
April 16, 2019
IN THIS ISSUE
ASSESS MARKET DIRECTION WITH TURNING POINTS
TRADING WHEN YOU DON’T HAVE A CLOSE
WANT FASTER ANSWERS TO TECH SUPPORT QUESTIONS?
_____________________________________________________________________________________________________
ASSESS MARKET DIRECTION WITH TURNING POINTS _____________________________________________________________________________________________________
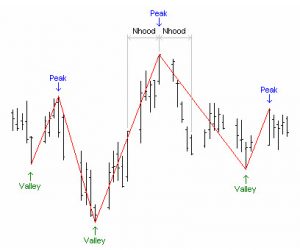
The Turning Points add-on is based on the concept of recognizing local peaks and valleys where a price time series changes its direction from up to down (peak) and from down to up (valley). You can leverage this information in a prediction combined with other indicators to generate buy/sell signals. We’ll show you how this is done, but first we should explain the basis for determining a turning point.
The Turning Points Indicators
A turning point (TP) peak is defined as the point where the high is higher than or equal to any other highs in the neighborhood of the point. A turning point valley is defined as the point where the low is lower than or equal to any other lows in the neighborhood of the point.
The neighborhood of a point (Nhood) ranges from a number of bars (Nhood) to the left and right of the turning point, inclusive of the endpoints. Therefore, the total number of bars included in a turning point analysis is 2*Nhood+1.
After the turning points engine has established the location of each turning point on the chart, a number of indicators can be built on top of them.*
Turning Points Support and Resistance Oscillators
The Support Oscillator indicator computes (in percentage points) how many previous support levels the current Close price “breaks up”. The Resistance Level indicator output is a horizontal line representing the price level of a recent turning point peak. The indicator compares the current close price against a number of the most recent support levels. If Close is lower than all of them, the indicator output is 0%. If Close is higher than all of them, then the indicator output is 100%.
Higher Support Oscillator values may indicate higher price support. A Support Oscillator value 0% means that there is no support for the current price from previous support levels.
The Resistance Oscillator indicator computes (in percentage points) how many previous resistance levels the current Close price “breaks up”. The indicator compares the current close price against a number of the most recent resistance levels. If Close is lower than all of them, the indicator output is 0%. If Close is higher than all of them, then the indicator output is 100%.
To insure symmetry, the number of bars to the left and right of turning points (Nhood) were linked together in all of the Turning Point indicators. The number of turning points pierced in the support and resistance oscillators were also linked. Both of these values are individually optimized for each security. Click here for more information on how to link indicator parameters.
Turning Points Slope
The TPslope indicator computes the slope in price either between two arbitrary turning points (TP) or between a turning point and the current bar. In our example we’re going to use it as an indicator for market trend between the most recent turning point and the current bar.
Combine with Other Indicators to Create the Prediction
To complete the inputs to the prediction, we’re going to use the Linear Time Regression Slope indicator as another measure of the trend and the On-Balance Volume indicator.
(See last month’s newsletter on using OnBalance Volume indicator for looking at trends. Click here for the newsletter.)
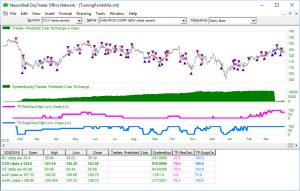
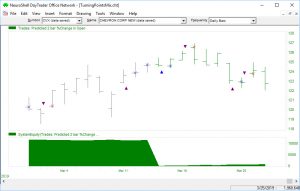
Results
We applied the prediction to a portfolio of five stocks. The combination of Turning Point indicators and other technical indicators showed profitable results. https://nstsupport.wardsystemsgroup.com/support/files/Apr19newsletter.zip to download the newsletter example chart. You must own the Turning Points Add-on to see the results.
For more information on the Turning Points indicators, click here to view the product manual. The add-on includes additional example charts.
*Some of the Turning Point indicators are calculated based on all of the data in the chart and are not suitable for use in predictions and trading rules because they “peek” into the future. These exceptions are noted in the help file.
______________________________________________________________________________________________________
TRADING ON THE CLOSE WHEN YOU DON’T HAVE A CLOSE
______________________________________________________________________________________________________
A Tip for Daily Charts
Customers who use real-time datafeeds such as DTN IQFeed and IBFeed and working with daily bars sometimes tell us that they can’t decide on their trades for the next day’s markets because the data vendor doesn’t send a close bar until late in the evening. (The eSignal interface is not affected since it is hard-coded and is capable of processing the end-of-session event.) As you know, NeuroShell Trader issues a trading signal after the close of a bar. But here’s a tip that will let you get to bed before midnight and still let you send your trade to your broker in the evening.
Approximately 5 minutes before the end of market hours, save the chart with data. (Go to the File Menu, select Save Chart As, and then be sure to check the box beside Save Data in the Chart.) Close the chart, and then reopen it with the saved data. The chart will use the last close saved in the chart as the day close and produce a trading signal. Now you can just manually enter the trade with your broker. You don’t get the exact closing price used in the calculation of the trading signal, but you have the advantage of lining up your trades the night before rather than forgetting in the morning when the kids are late for school or bad weather makes your morning commute more hectic than usual.
The next day, simply open the chart without the saved data to see how your model is working under current market conditions.
_________________________________________________________________________________________________________
WANT FASTER ANSWERS TO TECH SUPPORT QUESTIONS?
_________________________________________________________________________________________________________
Technical support volume is increasing. Sales increased after NeuroShell Trader won the Number 1 2019 TASC Readers’ Choice award for Artificial Intelligence software so we have a lot of new users who need help.
When you send an E-mail question, include your full name and product serial number in your E-mail, otherwise you may have to wait longer for a response because we have to look you up in our records.
If you call us, give us your name and product serial number as well.
Mondays are our busiest days so it may take longer to receive an answer.