
Combine Turning Points Indicators in a Prediction
The Turning Points add-on for NeuroShell Trader can identify the probability that price has reached a peak or valley. It does this using standard statistical indicators. By applying the Trader’s optimizer, you can modify the indicator settings to maximize profit or meet another objective that you select.
How Do Turning Points Work?
By examining historical data and computing the the mean and standard deviation of the percent change in value from peak to valley or from valley to peak, it is possible to predict the probability that the most recent bar is at a new peak or valley. The mean value shows the average of the percent changes. The standard deviation shows how tightly all percent changes cluster around the mean value.
Predicting the probability of a new peak or valley is based upon the statistical properties of the mean and standard deviation in a normal distribution.
If the percent change in value from the most recent valley to the most recent bar equals the mean of all of the peak-to-valley percent changes in the window, then the probability that the most recent bar is at a peak is 0.5.
If percent change in value from the most recent valley to the most recent bar exceeds the mean of all of the peak-to-valley percent changes in the window by 2 standard deviations, then the probability that the most recent bar is at a peak is 0.977.
Levels less than 2 standard deviations above the mean will produce probabilities between .05 and .977.
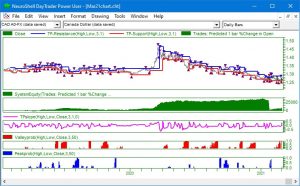
The chart above displays the Turning Points slope, Peak Probability, and Valley Probability indicators that were used as inputs to the prediction.
Building the Model
We used the Trader’s prediction wizard to generate the trading signals based on the Turning Points slope, peak probability and valley probability indicators.
The green equity curve displays the results for both the training and out-of-sample data.
https://Nstsupport.wardsystemsgroup.com/support/files/Mar21newsletter.zip to download the chart. You need the Turning Points add-on to open this chart.
Having a problem downloading our example charts?
Some browsers have added more security features which makes it difficult to download files. In Google Chrome, for example, you can fix the problem by right clicking on the download link and choose “Open in new tab”. You can then download the file.