
 These custom versions of standard indicators are designed to become less responsive during a trend so you stay in the trade and convert to be more responsive when the trend diminishes.
How Does It Work?
The indicators tailor their response to the trend by relying on another indicator to set the
number of periods for calculating the base indicator.
The Bowfort indicators include a parameter called “Adaptive Length” that is another time series
that would typically have a high value during a trend and a low value during sideways action.
In our example chart we used Linear Time Regression rsqrd that is found in the Regression
indicator category in Trader as the Adaptive Length parameter. Other suggestions from
Bowfort are the Virtual Horizontal Filter (VHF) that is included in the Bowfort indicator
set, as well as the Choppiness Index from Advanced Indicator Set 1 from Ward Systems
Group. The help file suggests that there are many other indicators that may be substituted.
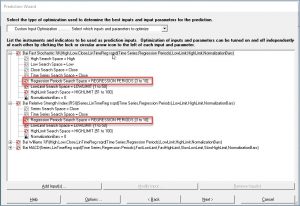
Our example chart used four of the Bowfort indicators in a prediction. We linked the
number of regression periods in the Adaptive Length parameter so they would optimize to
the same value.
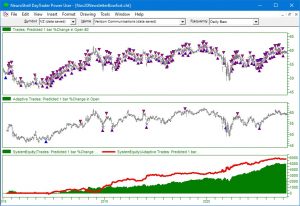
The top graph uses standard versions of RSI, Stochastic %K, %R and MACD while the
second graph shows the results with the Bowfort Adaptive indicators. The red equity curve
refers to the Bowfort model compared to the green curve for standard model.
https://Nstsupport.wardsystemsgroup.com/support/files/Nov20newsletter.zip to download the example chart. You must own the Bowfort Adaptive Indicators
to view all of the indicators.
To purchase the Bowfort Adaptive Indicators, visit www.Bowfort.com.