
Many traders come to us and want to build models that use their favorite indicators but do not have rules that determine when to trade. We advise them to use neural net predictions – no rules required.
The next question is how to build predictions that work in the future.
Below are some points to keep in mind while designing your prediction.
1 Will Nets Work on Any Security?
The answer is an emphatic NO. You may have to get out of your comfort zone and look at securities that have some up, down, and sideways movement so the net can find patterns. Securities that show a trend over a long period of time will not result in the most profitable neural net models.
2 Can a Net Be Too Good at Finding Patterns?
Yes it can. There are several ways that can happen. One is to include too many inputs in a net which can cause the model to overfit to the training data. We recommend no more than 5 to 10 inputs. If you have more inputs. feed them into a net in groups of 5 or so and then look at the contribution factors of each inputs in the results. Remove the low scoring inputs and add some others.
Another method is to use very few hidden neurons when optimizing the prediction. To change the number of hidden neurons, go to the Training tab in the prediction wizard and change the number of hidden neurons from the default value of 10 to 4 or 5. This step will also reduce optimization time.
3 Which Inputs Should You Choose?
In the Price Momentum category, we use ADX, CCI, RSI and Stochastic %K. We also like On Balance Volume from the Volume category. Look at Regression Slope and Linear XY Regression Slope (one value can relate two indexes) from the Regression category. From the Turning Points add-on look at Turning Points Slopes or Probabilities. Those are just starting points.
4 Which Output?
We favor detrended values such as percent change in price or a technical indicator, 1 to 3 periods in advance.
5 How Much Data Do You Need to Train a Model?
The following tip from our tech support site explains this part of the equation. Note that Steve Ward created the neural net algorithm and genetic algorithms that are included in NeuroShell Trader. He spent years developing trading models with the software and shared his insights on data here:
Selecting in-sample, paper and out-of-sample periods.
6 Any Other Tips?
Use different objective (fitness) functions when optimizing. Find the objective functions on the Training tab of the Prediction Parameters section of the wizard. These can make all the difference in the world.
7 How Do You Identify a Net that Works in the Future?
The predictions in this chart use indicators from the Price Momentum, Change, and Regression categories. The training objective is to Maximize Return on Account * Equity Curve Correlation in order to make profits while minimizing drawdown. The model optimized indicator parameters.
The chart below displays trading signals for both the training (gray) and out-of-sample period (green).
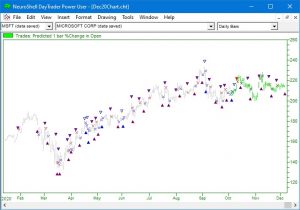
Examine the Chart Above
The trading signals appear at peaks and valleys in both the training (optimization) period and (most importantly) during the out-of-sample trading period.
The out-of-sample equity is not based on one or two “lucky” trades.
Very few models last forever because market conditions change. Neural nets need to be retrained either by using the “Retrain” button in the Prediction wizard or using a Trader add-on such as Adaptive TurboProp2 which allows you to specify how often to automatically retrain the net.
If there is a significant shift in the market, you might have to find new indicators or even switch to a different security.
https://Nstsupport.wardsystemsgroup.com/support/files/Dec20newsletter.zip to download the chart.