
A frequent question we get from new NeuroShell Trader users is what are the best
inputs to use in a neural network prediction. Our answer is “it depends”.
There is no single correct answer for inputs as there is no single model that works for
all securities.
Do not despair. We’re going to share techniques that we use to find good inputs.
Step 1: Pick the Right Securities to Model
Trending securities do not result in the best prediction results.
Why? Your net quickly learns to make predictions that follow the trend. If the
net is trained on inputs when the price is rising in a smooth line, the net will learn
to predict that the price is rising and be correct most of the time.
What happens when the market does not trend? You’ll find that your models
are more accurate when you train them on securities with some up, down, and
sideways movement.
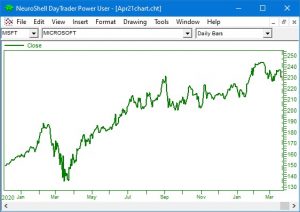 Even though Microsoft increased in price overall, there is enough up, down, and sideways movement to train a net
to make correct predictions during different market conditions.
Step 2: Graph the Potential Inputs
Graph indicators is to eliminate indicators that calculate peaks and valleys at the same
point. If an indicator graphs a unique pattern, it is more likely to feed distinct information
into your model.
We chose two types of indicators – the top set are those that are very responsive and the
other set show a smoother picture of market direction. Both enhance the model.
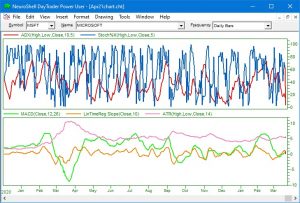
We separated the indicators into two different subgraphs based on relative value for visual purposes only. The TurboProp2 net in the prediction wizard automatically scales all inputs.
Some of our favorite indicators include:
Price Momentum Indicators:
Average Directional Movement (ADX)
Relative Strength Index (RSI)
Average True Range (ATR)
Stochastic Percent K (Stoch%K) or other Stochastic indicators
Regression Indicators:
Linear Time Regression Scope to monitor trend
Trader Add-ons
Turning Points Peak and Valley Probability indicators and Turning Points Slope anticipate change in
direction.
InterChart Tools TradeGate indicators optimize when to trade – either independently or in conjunction
with your trading system.
Bowfort Technologies Adaptive Indicators – These custom versions of standard indicators are designed
to become less responsive during a trend so you stay in the trade and convert to be more responsive
when the trend diminishes. To learn more, visit www.Bowfort.com
Step 3: Check the Contribution Factors
Once you have created the prediction, click on the “Detailed Analysis” button at
the end of the prediction wizard to view the relative importance of each input. If
your model is not getting the results you want, remove some of the indicators with
lower contribution factors and substitute new indicators.
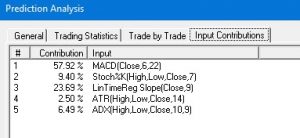
We recommend using 5 to 10 inputs at a time to prevent overfitting your model to training
data.
Step 4: Are the Buy/Sell Signals on Peaks and Valleys?
Your work is not done until you see buy/sell signals that appear at the peaks and valleys of
the price data. It does not count if the signals are correct only on the training (optimization)
data. The peak/valley signals have to hit peaks and valleys on the out-of-sample trading
data. Make sure you have enough signals in the trading data (out-of-sample data) to believe
that your model will work in the future before you live trade your model.
https://Nstsupport.wardsystemsgroup.com/support/files/Apr21newsletter.zip to download the example chart.
Just a reminder if you are having a problem downloading
our example chart —-
Some browsers have added more security features which makes it difficult to download files. In Google
Chrome, for example, you can fix the problem by right clicking on the download link and choose “Open in new
tab”. You can then download the file.
 NeuroShell Trader Won!!!
Voted 2021
Best Artificial Intelligence Trading Software
TECHNICAL ANALYSIS of
Stocks and Commodities Magazine
We want to thank the loyal NeuroShell Trader users who took the time to vote for us in
the 2021 TASC Readers’ Choice Awards competition. Your continued support is greatly
appreciated by all of us at Ward Systems Group.
Our thanks would not be complete if we didn’t include the wonderful staff at Technical Analysis
of STOCKS & COMMODITIES magazine who produce an industry leading publication.