
March 15, 2018
TRADE VOLATILITY WITH NEURAL NETS
PAIR TRADING THE S&P INDEX AND THE VIX
by Marge Sherald, President
An article by Andrew Sachais in the March 2018 issue of Technical Analysis of STOCKS & COMMODITIES describes buying the Cboe Volatility Index (VIX) when it is rising and when the S&P 500 Equal-Weighted Index (SPXEW) is trading below its 10, 20, and 40-week moving averages.
It looked like a perfect setup for a pair trading system. However the SPXEW is trading around 4000 and the VIX is trading around 20 as this article is being written, so the prices don’t cross naturally as they would in a traditional pair trading system.
The solution comes in the form of the Proxy Pair Trading indicators from Advanced Indicator Set 3. These indicators allow you to use one security to predict another. The spread between the security’s actual value and the net’s predicted value determine buy/sell signals. When the spreads tighten up, the Proxy Exit indicators switch positions. If the trade goes against you, the Proxy Exit indicators include built in stops.
The Pair trading indicators in Advanced Indicator Set 3 are the only indicators that allow you to buy one security and sell another ON THE SAME BAR in NeuroShell Trader. The indicator parameters on the long and short side are linked to insure the trades occur simultaneously.
The Proxy Pair indicators were designed to use a neural net prediction to determine which one of several securities should be used to predict another. However, it can still work with one input, the SPXEW, to predict the VIX zero bars into the future.
For proper hedging, I needed to create a “loose” neural net that makes a linear prediction based on a single input rather than a nonlinear one. I did this by setting hidden neurons to zero. I specified the training objective to minimize mean squared error rather than use any of the profit objectives.
Once I had a prediction, I used the spread between the actual value of the VIX and the predicted value of the VIX to generate simultaneous buy/sell hedging signals with the Proxy Entry and Exit indicators. The chart includes separate chart pages for each security.
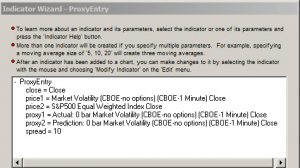 |
| The Proxy Entry conditions for the pair trading system. |
Let’s take a look at the parameters in the ProxyEntry indicator so you can understand how it works. First you insert the close of both securities as other instrument data on the chart. The close (on the current chart page) is matched against the other instrument data version of the close for Price 1 (VIX) or Price 2 (SPXEW). The ProxyEntry indicator uses this information to track which security goes long and which one goes short.
Traders often use complicated spread metrics between the two securities to gauge entry and exit points. The neural net method simply compares the actual and predicted versions of VIX (proxy1 and proxy2) in order to compute the spread, the last parameter, which produces the buy/sell signals. I set a range for the spread and let the genetic algorithm optimizer pick the most profitable value.
Exiting the Trade
The ProxyExit indicator also uses the spread between the actual and predicted values of the VIX to determine when to exit the trades. The stop spread is a built in protection to exit the trade when the market goes against your system. The stop spread may also be optimized.
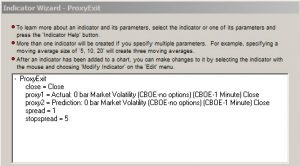 |
| The Proxy Exit parameters for the pair trading system. |
In the chart below, every time the Trading Signal generated a Long Entry signal for VIX, there was a simultaneous short entry signal for SPXEW.
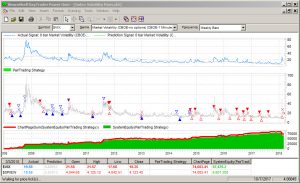 |
The green equity curve shows the results for VIX. The red equity line shows the equity added by trading SPXEW.
Click here to download the chart. You must own Advanced Indicator Set 3 to see the trading signals in this chart.
References
For a detailed description of how to set up the indicator parameters, see this tip from our technical support website: Pairs Trading (TASC December 2016).
The Advanced Indicator Set 3 help file includes detailed instructions on the pair trading indicators. You can read the help file here: Set 3 Help File