From time to time, we are asked if it is possible to create a MACD Histogram in NeuroShell Trader. The answer is yes, and it is quite easy to build.
The MACD Histogram is really just a subtraction of the MACD Signal indicator from the MACD indicator (both can be found in the Price Momentum category). Just make sure that the ExpAvg1 Periods parameter from the MACD indicator is the same as the ExpAvg2 Periods parameter in MACD Signal and that ExpAvg2 Periods in MACD is equal to the ExpAvg3 Periods parameter in MACD Signal.
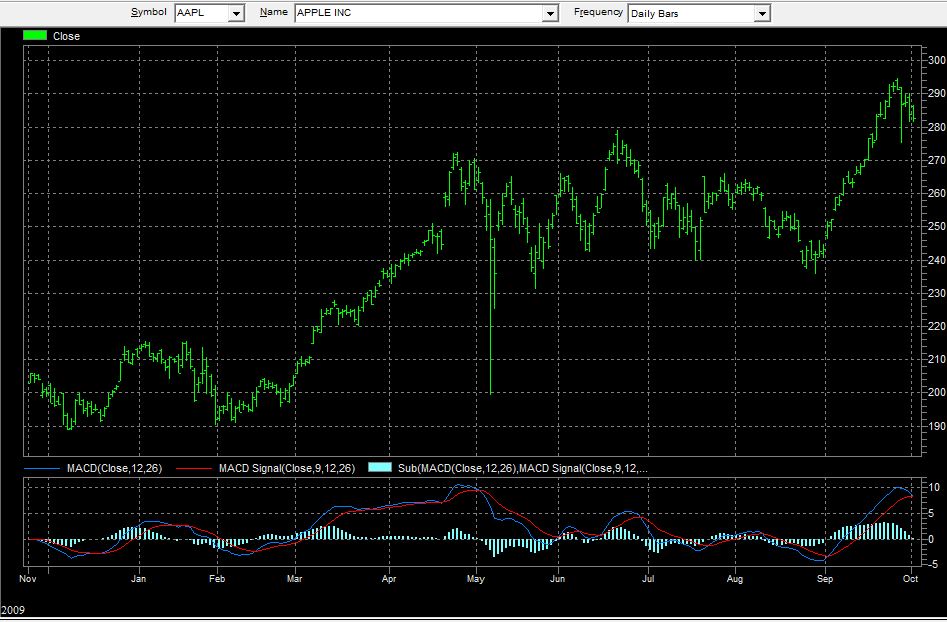
The commonly used method of displaying the Histogram is to change it to a Bar style graph and then overlay both the MACD and MACD Signal indicators on top of it as illustrated below: