
Here is the full write-up of the examples described in the article “Relative Performance Charting” in the March 2015 Newsletter.
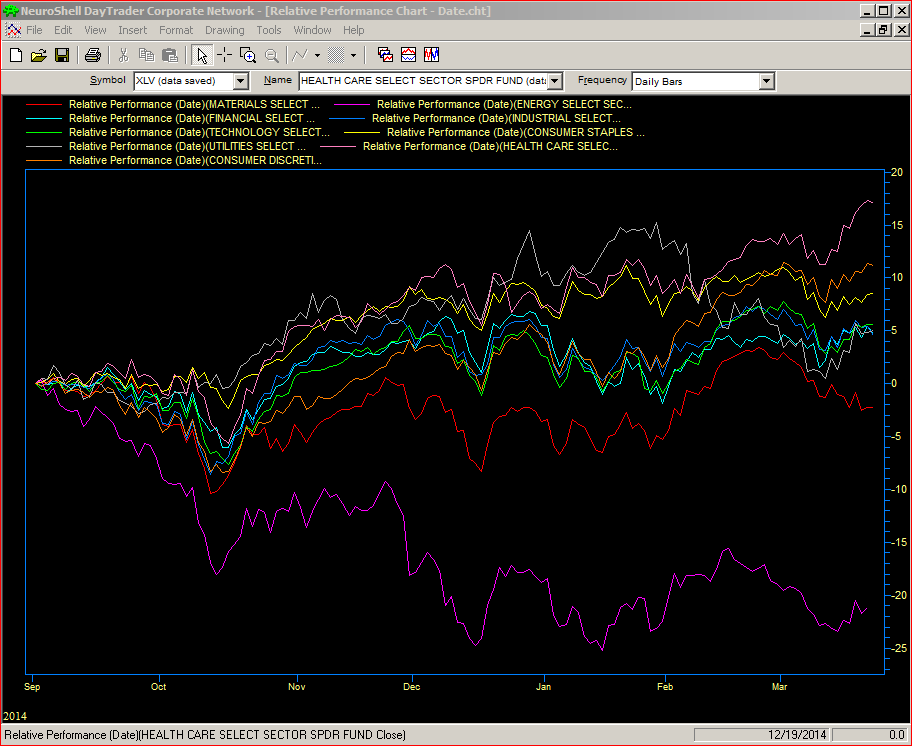
Relative Performance Chart – Date
This chart mimics the chart shown in Figure 1 on page 45 of the April 2015 issue of Technical Analysis of Stocks and Commodities.
Here we use the Format/Format Chart/Dates dialog to determine our starting and ending points for the Relative Performance Calculation.
You can see the underlying code for the Relative Performance Indicator by right clicking on any of the displayed indicators and selecting “Modify Selected Indicator”. Once you see the Indicator Wizard, click on the name of the indicator and then press the Modify Indicator button. As you can see, we used the Remember indicator from Advanced Indicator Set 3. The usage here is to set our starting point for the calculation.
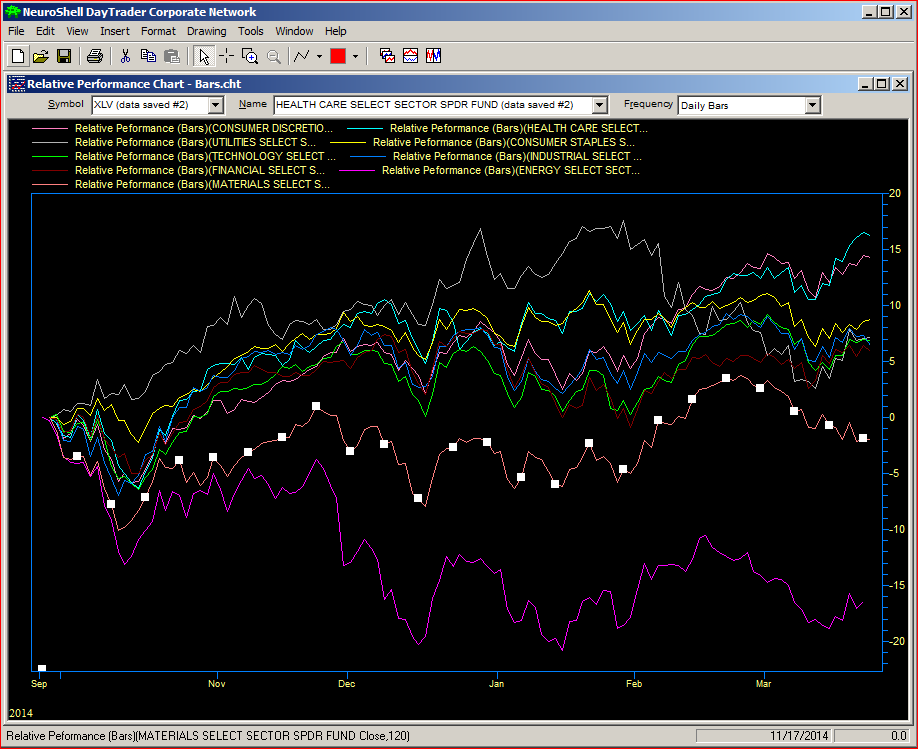
Relative Performance Chart – Bars
This chart is similar to the one above based on the Date, but this one calculates the Relative Performance over a number of bars rather than a specific date.
Again, you modify the indicator to see the underlying code as described above. You can see here in addition to the Remember indicator, we also use BarCount, from Advanced Indicator Set 2.
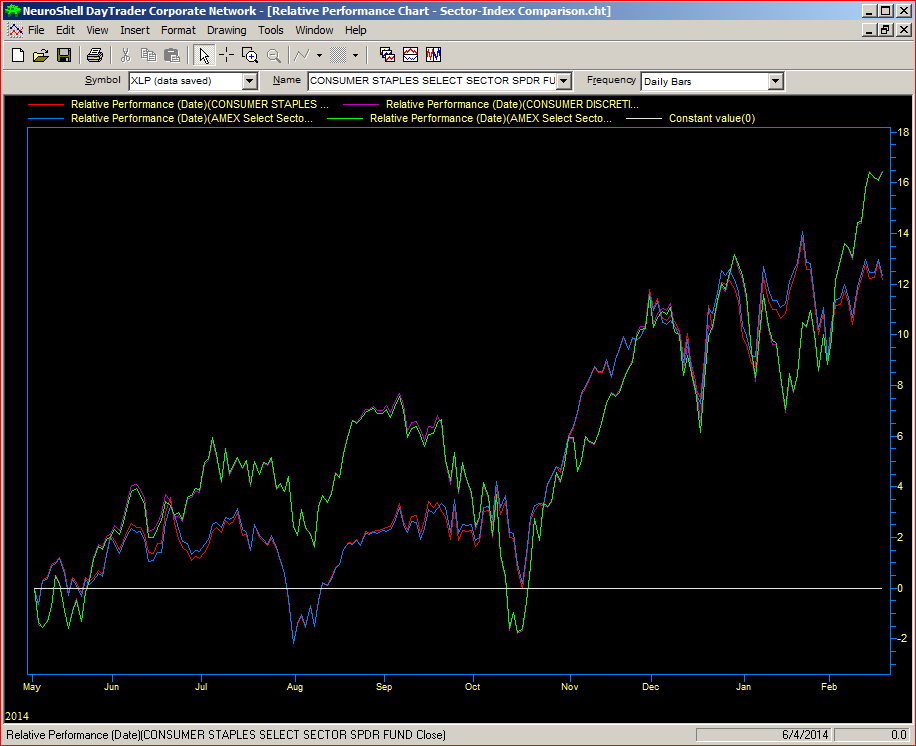
Relative Performance Chart – Sector-Index Comparison
The next example mimics Figure 3 on page 46 of the magazine article. Here we simply take the Relative Performance based on date and apply it to two sectors and their indexes.
Relative Performance Chart – Stock-ETF-Index Comparison
The next example mimics Figure 4 on page 47 of the magazine article. Here we simply take the Relative Performance based on date and apply it to a stock, it’s sector ETF and it’s sector Index.

Relative Performance Chart – Bars (IC1)
This last example is an extension of the Bars example above and illustrates a alternate usage of the SendStream and GetStream Indicators from InterChart Tools 1.
As illustrated in the Bars example, there are NINE different Relative Performance Indicators on the chart based on a specific number of bars, let’s say 120 bars. So let’s assume you just finished building your chart with the NINE different Relative Performance indicators set to 120 bars, then you decide you want to change to 90 bars. This would require you to change NINE different parameters! Imagine if you had 12, 15 or even 20 different issues in your Relative Performance comparison!
With SendStream and GetStream from the InterChart Tools 1 add-on, this process can be simplified so you would only have to change ONE parameter and have all NINE Relative Performance Indicators update automatically!
If you open this example, you will see there are some Relative Performance indicators in subgraph 1 and a SendStream in subgraph 2. Looking at the SendStream, you can see it’s Stream parameter is set to Constant Value (120). Constant Value, by the way, is from Advanced Indicator Set 1. You could also use Add2(120,0). This represents the number of bars to use in the Relative Performance calculation.
Now if you modify one of the Relative Performance indicators in subgraph 1, you can see that rather than a static Number of Bars, such as 120, we are using GetStream instead. This usage is in a sense like using a variable in programming.

So let’s change the SendStream from 120 to 90 and see what happens.
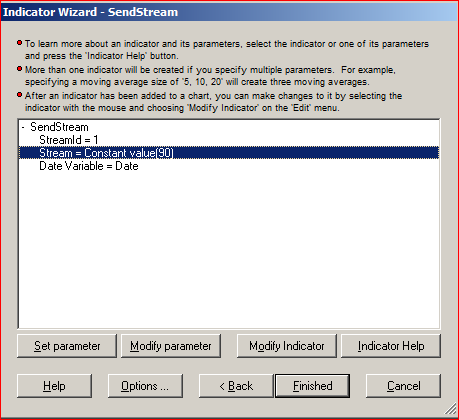
Once we press Finished, all of our Relative Performance indicators will now adjust their calculations based on 90 bars.

Click here to download a ZIP file containing all of the charts illustrated.