Save Time Building Multiple Versions of Indicators – No Coding Required!
Building technical indicators can be a tedious process, especially if you want to test multiple versions of the same indicator. NeuroShell Trader’s indicator wizard lets you build multiple versions of the same indicator in a single pass. You can create 5, 10, and 15 period versions of RSI (Relative Strength Index) or a Regression Slope indicator. You can include different time series as well.
How Does It Work?
The following examples give you the details on how to quickly build multiple indicator copies when you first add an indicator to a chart.
Add Multiple Indicator Parameters
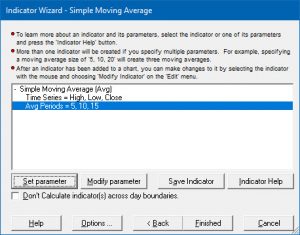
You can add multiple values separated by commas for a numeric parameter such as the number of periods used to calculate a moving average.
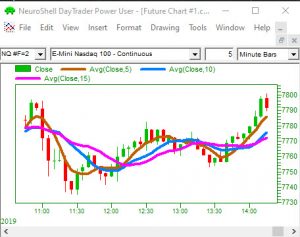
We entered 5, 10, and 15 for the number of periods and all three indicators are automatically graphed on the chart.
Add Multiple Data Series
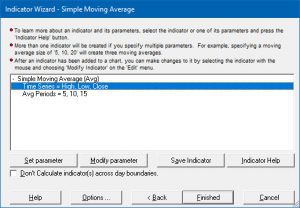 You have the option to add more than one time series in the indicator wizard. You can set the Time Series parameter to price data, indicators, or other instrument data.
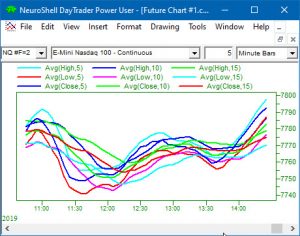
Setting the Time Series to High, Low, and Close and Avg Periods to 5, 10, and 15, created nine separate indicators in one pass. This technique makes it easy to visualize the same indicator over different time periods to look for trends.
Let the Optimizer Pick the Time Series
You can let the optimizer choose from several different data streams. For example, the RSI defaults to the close for its calculations, but you could add the high and low data streams and let the optimizer select which one to use in either a Prediction or Trading Strategy.
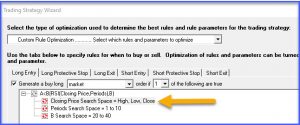
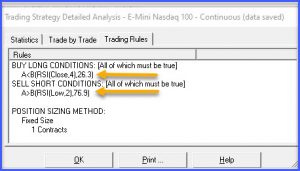
In our example chart the final Trading Strategy used the RSI based on the close for the Long Entry rule and the Low for the Short Entry rule.
It Even Works on Bar Size
Power User versions of NeuroShell Trader can pick the bar size for Trading Strategies, predictions or indicators. To learn more, click here to view the article from our August 2015 newsletter.
https://nstsupport.wardsystemsgroup.com/support/files/Oct19newsletter.zip to download the example chart from this article.
Build Readable Trading Formulas with ChaosHunter
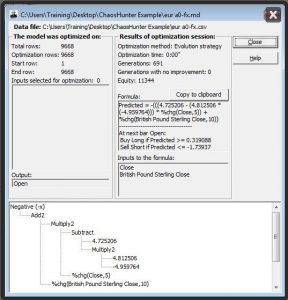
ChaosHunter is a software system designed to produce equations to help understand and model data.
Use ChaosHunter to find relationships in market data, including historical data for stocks, Forex and futures. The model can be inserted into many trading platforms. NeuroShell Trader includes special indicators that allow you to incorporate ChaosHunter models with your trading system.
Build Ensemble Trading Systems – Increase Probability of Correct Signals
ChaosHunter develops multiple models while it is optimizing, so you can easily create an ensemble trading system that specifies a buy when 2 out of 3 systems agree.
Click here to learn more about ensemble trading systems.
