
August 27, 2019
IN THIS ISSUE
TIPS FOR BUILDING SUCCESSFUL NEURAL NET TRADING MODELS
FIRST SOME PERSPECTIVE
The first thing you must appreciate is that successful financial models (i.e., those that consistently make money) are not easy. If they were, there would be an awful lot of rich people. Neural nets are not magic; they are excellent modeling tools. Furthermore, financial markets are driven by a myriad of complex variables that are frequently changing. It is therefore quite unreasonable to expect that any model you build will be 100% right 100% of the time, or anything even approaching that goal.
You will be successful if you can build some models that make money most of the time. At various times you will have winning trades on some issues, and losing trades on others, but you should try to find a strategy that plays the odds with several models or at lease several issues you are trading. The idea is to build a system that makes more money on average than it loses, that doesn’t take any large losses, and that does better than you can do trading with your own brain’s neural networks.
PICK THE RIGHT SECURITY
If you’re building a prediction model, it’s a better idea to select a volatile issue rather than an issue that is simply trending. That is because neural nets are most effective learning patterns in volatile issues where there are more varied patterns in the relationships between inputs and the predicted output value.
MORE DATA IS NOT ALWAYS BETTER
If you try to bullet proof your model by loading too much historical data, the input patterns found during training will be substantially different from those showing up today. Even if you have great inputs that are normalized over time, it is likely that as markets change, so does the effectiveness of your input variables.
WHAT TO PREDICT
When you set the output in the Prediction Wizard, percent change in open is the default setting. You can place successful trades if you know market direction up or down; you don’t need an exact price. Percent change normalizes data over time even when there is a large price jump during the training period. Of course, NeuroShell Trader has other output options, including the ability to predict another indicator.
MORE INPUTS ARE NOT ALWAYS BETTER
Make sure you stick to a very few inputs to neural nets (usually about 5). When finding an optimum set of inputs, tell the optimizer to use at most 5 inputs.
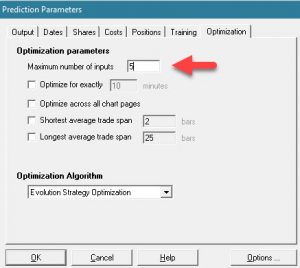
The Optimization tab allows you to limit the number of inputs.
Why? Because too many inputs cause a model to overfit the training data and not perform well on new data, which is the whole point of building a model.
If you want to look at more inputs, test them in small groups and then look at the contribution factors to decide which ones to keep. (See below for more information on contribution factors.)
WHICH INPUTS SHOULD I USE?
We generally suggest to new users that they start with indicators from the Price Momentum and Volume categories. Another favorite is the Linear Time Regression Slope Indicator in the Regression category.
- Use indicators you know
- Look at the example charts and videos for some of our favorites
- Graph indicators on the chart and look for ones with different patterns
- Use ratios or change indicators rather than price
UNDERSTAND CONTRIBUTION FACTORS
If you click on the Detailed Analysis button at the end of the Prediction wizard, you’ll find the “Input Contributions” tab.
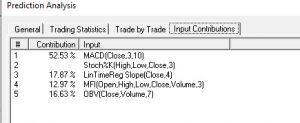
This model eliminated Stoch%K as an input.
The Contribution factor is a relative measure of how significant each input is to the model. Values range from 0 to 100. Higher values are associated with more important variables (inputs). If the importance of an input value is 0, most likely that input is useless and might as well be omitted. The same may be said for some of the lowest contributing variables.
However do not assume that if the importance value of input A is 10 and the importance of input B is 5, that A is twice as good as B. We can only say that A is more important than B.
In fact, contribution factors are only a guide. They should never be considered highly accurate. If you use too many inputs (more than 10), the accuracy of the contribution values will decrease. If you want to test a large number of inputs, we suggest that you test them in groups of 10 and then use a few of the best ones from each group in the final model.
HOW TO JUDGE A MODEL’S SUCCESS
Neural nets are very good at learning patterns in training data. The real test is to see if the trading signals in the OUT-OF-SAMPLE trading period appear on the peaks and valleys. Make sure there are more than a few “lucky” trades (very profitable winners that don’t occur often) in the out-of-sample period to give you confidence that the model will work under different market conditions.
Be sure to click on the Detailed Analysis button on the training results screen to examine whether the signals meet your trading requirements.
Here is our example chart which shows appropriate trading signals at peaks and valleys in both the optimization (training period) and the trading (out-of-sample) period.

Note that the signals hit peaks and valleys in both the optimization and trading periods.
https://nstsupport.wardsystemsgroup.com/support/files/Aug19newsletter.zip to download our example chart.
Learn More – Visit our tech support site at www.Nstsupport.wardsystemsgroup.com.