
October 24, 2016
IN THIS ISSUE
CUSTOMIZE YOUR MACD TRADING STRATEGY
FREE VOLATILITY INDICATOR
CUSTOMIZE YOUR MACD TRADING STRATEGY
In the article titled “The Finer Points, Critical MACD Levels” that appears in the October 2016
issue of TECHNICAL ANALYSIS OF Stocks & Commodities magazine, author Kevin Luo
describes how sometimes the traditional settings for the MACD indicator miss the mark in
generating profitable trading signals depending on how much the market is trending.
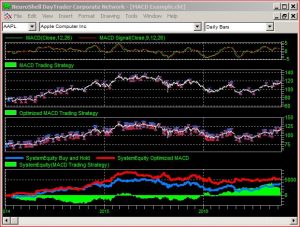
The MACD indicator displayed on the chart calculates the difference between the 12 and 26 period exponential moving averages of the close.
In his article, Luo ran optimization tests on portfolios of up to 500 stocks. He found the MACD settings that were successful on the majority of the stocks in the portfolios. He also suggested the use of filters to remove losing trades. One filter only bought when MACD was in the range 0 to -1.5. However, this filter sometimes removed profitable trades as well as the losers.
An Alternative Approach – NeuroShell Trader Can Customize the Settings for Each Stock
Rather than using the same MACD settings for all stocks in the portfolio, you can create a
multi-page NeuroShell Trader chart that finds custom MACD parameters. Simply
choose full optimization or parameter search when setting up the Trading Strategy.
The custom MACD parameters outperformed both the trading strategy with the traditional
MACD settings and buy and hold. In the chart above, the red line in the bottom subgraph displays the equity curve for the custom MACD settings.
If you prefer to have the same MACD parameters for the entire portfolio, open the Advanced
tab in the Trading Strategy wizard and check the box to optimize the parameter settings
across all chart pages. You can download a copy of the example chart from the Examples section.
 Common Tech Support Issues – VOLATILITY INDICATOR
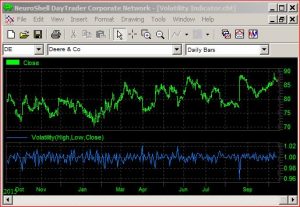
Volatility is the dispersion of returns for a given security or market index. It is
quantified by short-term traders as the average difference between a stocks daily
high and daily low, divided by the stock price (in the example below we used the
close).
Download this chart from the Examples section so you can add the volatility indicator to your Trader library. Once you have loaded the chart in NeuroShell Trader, the Volatility indicator will be saved in the custom indicator category for use in other charts.