CREATING A TREND CONFIRMATION SYSTEM IN NEUROSHELL TRADER
CONFIRM THE TREND USING LARRY WILLIAMS’ %R INDICATOR
The March 2016 issue of Technical Analysis of STOCKS & COMMODITIES magazine includes an interview conducted by editor Jayanthi Gopalakrishnan with Price Headley. Headley is a well known TV and industry expert who founded BigTrends.com to generate stock and options strategies that profit from significant market trends.
One of the trading systems Headley discusses is based on the Williams’ %R indicator which measures price momentum. Mathematically, %R ranges between values of 0 and 100. The closer %R is to 0, the stronger an indication of an uptrending market. The closer %R is to 100, the stronger an indication of a downtrending market.
Headley advises that the rules described below work better when they are applied to volatile instruments with high liquidity.
In the BigTrends %R Bull and Bear Rules that appear in the article. Headley uses the %R indicator to determine an overbought market when the indicator crosses above 80 (the setup bar for a bull market) and an oversold market when the indicator crosses below 20 (the setup bar for a bear market).
Bull Confirmation Headley’s system does not immediately enter the trade at the setup bar. Instead he “confirms” the trend by verifying if one of the next five bars closes above the high of the setup bar for the bull confirmation.
The question becomes how to code this sequence of events in NeuroShell Trader. We used Advanced Indicator Set 3’s Remember indicator to keep track of the high of the setup bar and then chose the Followed By Within indicator to link the sequence of conditions within a number of bars specified in the “Bars” parameter.
The Bull Confirmed indicator insures that the condition indicating a trend extends beyond a single bar.
Bull Retest
Once Headley’s trading system confirms the Bull market, he looks for a low-risk entry point before entering the Long trade. The entry point is determined by the bar where the %R indicator crosses below the overbought level, which he calls the Bull “retest bar”. Note that this is not the lowest price, but you enter the trade on a steady trend.
The Bull Retest bar is a low risk entry point.
Bull Retest Violation
If any of the bars after the retest bar close below the low of the retest bar, the trend is violated and the system exits the trade. Note that once again this is a sequence of conditions, so the FollowedBy indicator is used. This version of the FollowedBy indicator does not have a window size so it does not include a “Bars” parameter.
If any of the bars after the retest bar close below the low of the retest bar, the system exits the trade.
On the Short side, the opposite of these rules was used with a threshold value of 20.
Note that the Williams %R indicator, which is the basis for many of these “testing indicators”, includes a Stochastic Periods parameter. In the trading system we created, we linked this parameter to the same values each time it appeared in the trading rules. Linking parameters decreases optimization time because there are less parameters to optimize. Look for the Trader help file topic called “Parameter Search Space Dialog – Numeric” for details on how to link parameters.
After much testing, Headley settled on using a 30 bar setting for the Stochastic periods, which was longer than the usual setting of 14 bars. Since we had the advantage of the Trader’s optimizer, we set the range from 14 to 30 so the Stochastic period value is individually set for each stock. To determine the best value, we used an optimization objective of “Maximize Expectancy”. Expectancy provides a measure of a systems reward to risk ratio and is calculated as the Average Trade Profit divided by the Average Losing Trade Loss.
https://www.nstsupport.wardsystemsgroup.com/support/files/Mar16Newsletter.zip to download the chart described in this article.


 One of the trading systems Headley discusses is based on the Williams’ %R indicator which measures price momentum. Mathematically, %R ranges between values of 0 and 100. The closer %R is to 0, the stronger an indication of an uptrending market. The closer %R is to 100, the stronger an indication of a downtrending market.
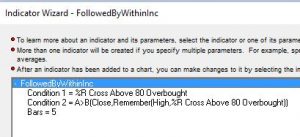 The Bull Confirmed indicator insures that the condition indicating a trend extends beyond a single bar.
