
June 2, 2020
IN THIS ISSUE
Balance Your Portfolio to Increase Profits
Chart Page Indicators Lead the Way
We are often asked by customers how to build models that balance their existing portfolios. One technique is to use ranking indicators from the Chart Page Calculations category.
The indicators operate across all chart pages, which makes them useful for portfolio summaries. You can use them to create hedged portfolios.
We built an example based upon the Average True Range indicator, but obviously any indicator or neural net prediction signal could be used instead. The idea is that the trading strategy buys stocks in the chart that have the lowest Average True Range values, and sells those same stocks when the Average True Range is no longer among the lowest in the chart.
If you inspect the portfolio view you will see that a stock has a lower rank of 1 whenever the Average True Range is the lowest of all stocks in the portfolio.
Long Entry
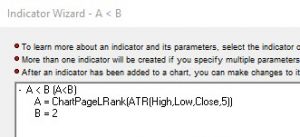
Buy whenever the Chart Page Lower Rank is <2 (buy when the Average True Range is the lowest compared to the other securities). Exit when the rank is >3 (exit when at least three stocks are ranked higher in terms of lower Average True Range values).
Short Entry
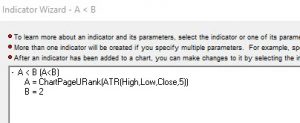
For the Short side, we switched to using the Upper Rank indicator. A Short Entry occurs when the Upper Rank < 2 and a Short Exit is triggered when the Upper Rank > 3.
Hedge
Rather than buy a specific number of shares we used a fixed dollar amount of each stock to maintain the hedge. This method takes into account the varying stock prices in the portfolio.
Results
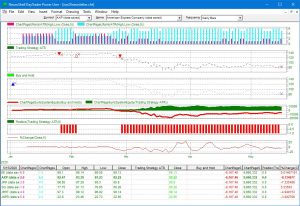
To top everything off, we used the chart page sum indicator to sum the equity curves of all stocks. We created a buy and hold trading strategy which entered on the first bar of the chart with the condition Close = Close and set the exit condition to Close = 0, which is unlikely to occur. We added a chart page sum indicator to the buy and hold equity curve for purposes of comparison to our trading strategy.
Our trading system generated $9660.33 in profits, compared to a loss of $6167.46 for the buy and hold system.
https://nstsupport.wardsystemsgroup.com/support/files/Jun20newsletter.zip to download the example chart.
More Examples
NeuroShell Trader Example Charts 17 and 18