
July 19, 2018
IN THIS ISSUE
CAN YOUR MODELS RE-BALANCE YOUR PORTFOLIO?
DO YOU HAVE THE LATEST SOFTWARE?
NEUROSHELL TRADER ADVANCED TRAINING
_________________________________________________________________________________________________________
CAN YOUR MODELS RE-BALANCE YOUR PORTFOLIO?
We’re going to continue our discussion of models that work in volatile markets by showing you how to re-balance your portfolio weekly by ranking the securities according to the percent change in price. 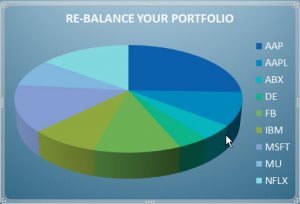
Step 1 – Rank the Stocks
We begin with a potential portfolio of 10 stocks and wish to buy the top three with the largest percent change in price and sell the ones with the smallest percent change in price over a 5 day period.
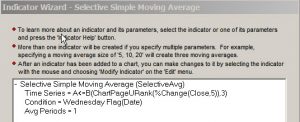
We’re going to use the Selective Simple Moving Average Indicator (from the Selective Calculation category) in order to “remember” the top three stocks to buy based on the largest percent change over 5 days.
The Selective Simple Moving Average allows us to add the condition “Wednesday” which is when we want to re-balance our portfolio. A Selective Simple Moving Average of 1 checks the condition every day but only “remembers ” the percent change value on Wednesday (or another condition that you specify).
|
The Chart Page Upper Rank indicator looks at all of the stocks and identifies the top three with the highest percent change in close over 5 periods.
|
We created another Selective Moving Average using the Chart Page Lower Rank indicator to identify the stocks we wanted to sell.
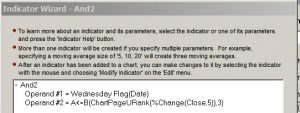
Step 2 – Build the Trading Strategy
Next we had to turn our flag indicators into buy/sell conditions. We used the Boolean AND indicator to combine the two conditions so they have to be equal to 1 (True) on the same bar.
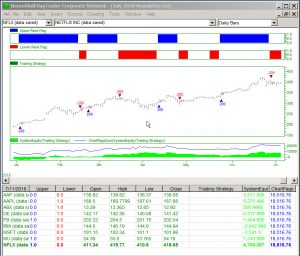
The results appear in the chart below. Note that the portfolio summary at the bottom of the chart shows three stocks ranked as “Upper” and three stocks ranked as “Lower”.
We used the Chart Page Sum indicator to add up the equity curves for all of the stocks in the portfolio.
We noted different results depending on the day of the week when we balanced the portfolio. A web search shows a variety of opinions. You may just want to let the NeuroShell Trader’s optimizer pick the day for you.
You can download our example chart by clicking https://www.nstsupport.wardsystemsgroup.com/support/files/Jul18Newsletter.zip.
______________________________________________________________________________________________________
DO YOU HAVE THE LATEST SOFTWARE?

DTN IQFeed has released version 6.0.0.5 of their Client software dated July 6th, 2018.
You also need to install the IQFeed Adapter for NeuroShell Trader 7 (version 1.1.0.2) dated May 23, 2018.
You can download both software programs from www.iqfeed.net.

TradeStation made a change to there web interface so we had to create a new version of the TradeStation Data Feed and Brokerage interface (dated 7/18/2018). You can download this software from www.ward.net in the NeuroShell Trader Downloads, Release news and Upgrade Information section. You need your NeuroShell Trader serial number and password to access the site.
You may need to update to version 4.6 of the .NET Framework in order to run this new version. A free update is available from Microsoft at https://www.microsoft.com/en-us/download/details.aspx?id=48130.
___________________________________________________________________________________________________________
NEUROSHELL TRADER ADVANCED TRAINING: Building Better Models with NeuroShell Trader
We are often asked about more advanced training on how to use NeuroShell Trader. We have decided to offer the materials from our Building Better Models webinar to our customers.
The webinar covers the following topics:
Preventing Overfitting
Optimization Tips
Pattern Recognition is Key
Automatically Adapting Models to Changing Markets
How to Use Adaptive TurboProp2, Neural Indicators, and Adaptive Nets Add-ons
Different Uses for Averages
*Variable Length Moving Average
*Building Trading Rules That Average an Indicator
The download package includes the following:
The PowerPoint slides used during the webinar
All example charts
An audio/video recording of the webinar
The cost of the training materials is $179.
Click here to order.