
July 18, 2013
IN THIS ISSUE
TECHNIQUES FOR BUILDING MORE ROBUST MODELS DURING TRENDING MARKETS
RESTRICTING TRADING HOURS IN NEUROSHELL TRADER AND CHAOSHUNTER
ADVANCED INDICATOR SET 3
TECHNIQUES FOR BUILDING MORE ROBUST MODELS DURING TRENDING MARKETS
By Denham Ward, Lead Developer of NeuroShell Trader
Building and optimizing trading models during long periods of up or down trending markets can be challenging. When optimized, the models tend to look at the recent price movements and recognize that trading exclusively long or short is the best solution. That’s fine as long as the trend continues, but those models tend to fall apart once the trend ends, resulting in large trading losses. In this article I want to explore techniques that can be applied to avoid this situation.
To highlight the problem, let’s assume that on May 14th of this year we decided to build and optimize a simple intraday only moving average price reversal system with the following rules:
Long Entry: Price>MovAvg(Close, 1 to 20)
Short Entry: Price<MovAvg(Close, 1 to 20)
Restrict Trading Signals to a specific time range: 9 AM to 4 PM
When optimized, we would have found that it made $4437 trading a single contract and based upon the profitable results decided to begin trading it. However, over the next two months of trading, we would have ended up losing $1850 trading a single contract with this model! What went wrong?
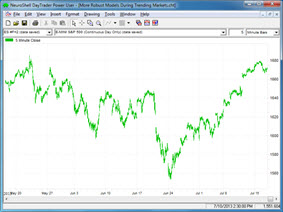
As you can see in the first chart below, the optimization price data had a consistent upward trend. But as the second chart shows, the following two months over which we traded no longer had a consistent up trend, but instead a mix of downward and upward trends.

Optimization Prices
Trading Prices
When the model was optimized, the optimizer actually found that a parameter combination that only allowed long trades made the most profit over the optimization data period up trend. However, during trading when the market changed trends, only trading long positions lost money!
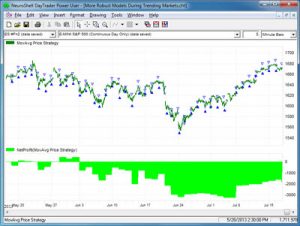
Trading the MovAvg Price Strategy
Now let’s see what could have been done to create a more robust model.
The first technique is to link each of the opposite long and short optimization parameters together so that the long average period size will be the same as the short average period size. By doing so, we are essentially restricting the optimizer to finding solutions with balanced long and short rules, which in turn should keep it from overfitting the data and finding excessively long or short biased solutions.
The trading rules are below.
Long Entry: Price>MovAvg(Close, AVG PERIODS 1 to 20)
Short Entry: Price<MovAvg(Close, AVG PERIODS 1 to 20)
Restrict Trading Signals to a specific time range: 9 AM to 4 PM
For this example, linking the long and short average periods together results in a smaller optimization period profit of $1637 per contract due to a more balanced long/short solution. However, the trading results after May 14th are a much smaller loss of only $325 per contract.
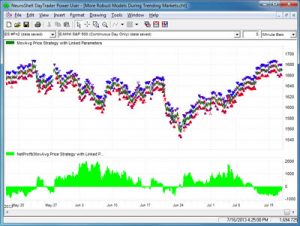
Trading the MovAvg Price Strategy with Linked Parameters
The second technique is to incorporate a different time frame into the rules using the NeuroShell Trader Power User version’s ability to combine multiple frequency data into a single chart, trading strategy, prediction or even a single indicator. By adding different time frames, we allow our model to be more robust by taking into consideration a much larger (or smaller) picture than the data it has available at its base frequency (5-minute data in this example).
The trading rules for the second technique are listed below:
Long Entry (all of the following are true):
Price>MovAvg(5 Minute Close, AVG PERIODS 1 to 20)
Daily: Price>MovAvg(Daily Close, DAILY AVG PERIODS 1 to 20)
Long Exit:
Price<MovAvg(5 Minute Close, AVG PERIODS 1 to 20)
Short Entry (all of the following are true):
Price<MovAvg(5 Minute Close, AVG PERIODS 1 to 20)
Daily: Price<MovAvg(Daily Close, DAILY AVG PERIODS 1 to 20)
Short Exit:
Price>MovAvg(5 Minute Close, AVG PERIODS 1 to 20)
Restrict Trading Signals to a specific time range: 9 AM to 4 PM
For this example, adding a rule that doesn’t allow long or short entries unless the daily price and moving average are in the same position as the 5-minute price and moving average, results in a $1625 profit over the optimization period, but most notably a $2262 profit per contract when traded after May 14th!
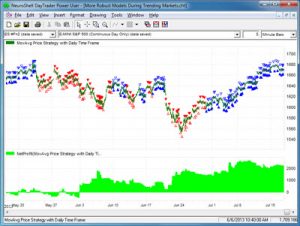
Trading the MovAvg Price Strategy with Daily Time Frame
So although training on data that trends in one direction can be problematic, by simply linking the parameters for a more balanced long/short solution and using the NeuroShell Trader Power User version to add an additional daily time frame rule, we were able to convert a model over fit to an upward trend that lost $1850 per contract during trading into a more robust model which would have made $2250 per contract when traded.
| Strategy | Optimization Profit | Trading Profit |
| MovAvg Price Crossover | $4437 | -$1850 |
| + Linked Parameters | $1637 | -$325 |
| + Multiple Time Frames | $1625 | $2250 |
Click here to download the NeuroShell Trader chart that illustrates the example trading strategies described in this article. The NeuroShell DayTrader Power User is required to open the chart.
___________________________________________________________________________________________________________________
RESTRICTING TRADING HOURS IN NEUROSHELL TRADER AND CHAOSHUNTER
By Marge Sherald, CEO
Deciding when you want your model to trade is an important consideration in the model building process. If you’re the type of person who likes to monitor your trades, do you really want your Forex model to trade all night? The backtest equity curve may look great, but upon closer inspection you may discover that the model made the majority of that equity during the dark hours when you would not likely be trading. Another factor might be that your model has to exit at a certain time so you don’t have to meet higher overnight margin requirements.
NeuroShell Trader
NeuroShell DayTrader offers several options for choosing when a model trades. Both the Prediction and Trading Strategy wizards include an option on the Dates tab to restrict the times a model is allowed to trade.
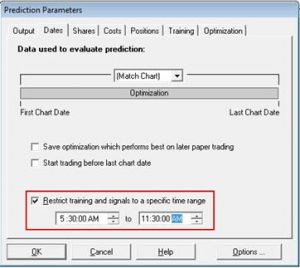
The Dates tab in the prediction wizard allows you to specify the times you want your model to trade. There is a similar tab in the Trading Strategy wizard.
The 5 minute chart for the AUD/USD Forex pair restricts trading to the times between 5:30 AM and 11:30 AM. http://www.Nstsupport.wardsystemsgroup.com/support/files/Jul13newslettertime.zip to download the chart along with the ChaosHunter models described below.
NeuroShell Trader offers another option that limits the data included in the chart to the time period you specify. First create a chart for the base time frame of interest, for example a 5 minute chart. Once the close data is displayed, go the Format menu and select Format Chart. The dates tab allows you to specify the beginning and ending times for the data used to create the chart. Note that if you choose the Format Chart option, all calculations for indicators, predictions, and trading strategies will only use the data included in the time range you specify. For example, if you choose a 20 period moving average, if the indicator can’t find enough data during the specified time range, it will go back to the previous day’s bars during the specified time range to find enough data for calculating the moving average. If you would prefer that the moving average is calculated by including the bars prior to the start of the specified time range, specify the time ranges in the prediction and trading strategy wizards instead.
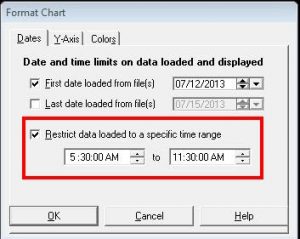
NeuroShell DayTrader versions include an option on the Format Menu that only loads data for the time frame you specify.
The DayTrader also lets you add Time Flag rules to your trading strategy. You can add a Time Flag that says the model may enter a trade after 10 AM, for example. Just make sure to lock the rule during optimization so the rule is not removed and the times aren’t changed.
ChaosHunter
ChaosHunter is able to restrict when a model trades through the use of a column in your data file that you identify as a time flag indicator.
ChaosHunter is only looking for either a 1, which means that you can enter a trade during this period, or a 0, which means that you cannot enter a trade during that period. If your model is currently in a trade and a value of 0 is encountered in the time flag column, the model generates an exit signal and then gets out of the trade on the next bar.
In addition to limiting trading to specific hours, the time flag may be useful in coaxing ChaosHunter to trade more often. When building intra-day trading strategies in ChaosHunter, for example, you might want to create a strategy that trades as frequently as possible and that does not carry an open position for a long time. The definition of “long time” can vary greatly. We heard from users who limit the maximum time span of an open position to as few as several 5-min bars. Other users prefer not holding a position for more than a day. One way to achieve that is by using smaller bar sizes such as 1- or 5-min and set commissions to a very low number or even to zero. In many cases this helps to increase the frequency of trades, but what do you do when you stick with the 1 hour bar size and want the model to close your positions in less than 24 hours? It can be a challenge to create a model that trades that frequently.
The solution is to use the time flag option in ChaosHunter. It allows you to set time segments (one or more) during certain hours when the trading is allowed. For other time intervals trading is disallowed. One important feature of the time flag option is that ChaosHunter automatically exits an open position when a trading segment ends.
You designate trading segments by placing in your data file an additional column called “Time Flag” filled with ones and zeroes. Mark all of the bars in a “trading is allowed” segment with the number one; mark all of the other bars with the number zero. When a ChaosHunter model holds an open position and “sees” a transition in the Time Flag column from 1 to 0, it automatically issues either a sell long or cover short signal thus closing the position and returning to neutral.
Note: NeuroShell Trader includes a Time Flag indicator (X <= Time <= Y) that allows you to specify a beginning and end time which generates 1’s and 0’s to designate being in and out of the range. Simply export the data from the chart, including the Time Flag indicator, using the Trader’s Tools menu Export Chart/Data option. After you’ve opened the data file in ChaosHunter, go to the Optimization tab and check the box to use a Time Flag series and then choose the correct column from your data file.
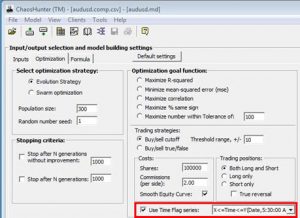
The Time Flag option appears on the Optimization tab in ChaosHunter
Here is an example. You trade a Forex pair on a chart with 1-min frequency and would like to unconditionally exit by midnight, but also would like to allow trading once the position is exited. To achieve that, create a time flag column in the data file that contains the number 1 on all bars from 12:01 AM through 11:58 PM. The two bars at 11:59 PM and 12:00 AM should contain zeros in the time flag column. Suppose your model has an open long position at 11:59 PM. ChaosHunter detects a transition from 1 to 0 on the 11:59 PM bar and issues a sell signal on that bar. The sell signal is then executed on the following 12:00 AM bar and the position is closed. The next trading segment starts immediately with the 12:01 AM bar and trading is allowed once again. Be sure to check the option to “Use Time Flag series” on the ChaosHunter optimization tab so ChaosHunter looks for a time flag column in the data.
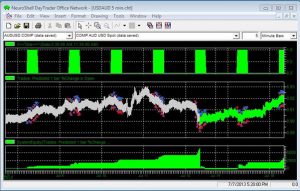
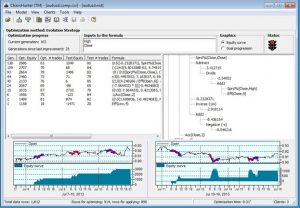
The ChaosHunter optimization screen below shows a model that only trades the USD/AUD Forex between the hours of 5:30 and 11:30 AM eastern time in the US. You can see from the step like equity curve that the model exits every day at 11:30 AM. This model uses a slightly modified version of the Steve Ward Trading Models Intraday template that is installed with new versions of ChaosHunter. Click here to download the data and model files for this example.
___________________________________________________________________________________________________________________
ADVANCED INDICATOR SET 3
We know that a lot of our users bought NeuroShell Trader because of the point and click indicator, prediction, and trading strategy wizards that allow you to build sophisticated models without programming. As users began to build their trading systems, they began to ask for even more indicators that could perform relatively simple tasks such as find and count, and Advanced Indicator Set 3 was born.
For example, one user wanted an indicator that found the max value from the time when a price series crossed above an indicator until the price crossed below that same indicator. The result was the Find indicator, which can calculate the max (or min) value from the time the close crosses above a 26 day moving average, until the close crosses below that same moving average, for example. In addition, the Find indicator can compute values such as how many bars occur between any two conditions, or what is the point change, percent point change, sum, average, standard deviation, variance, median, regression slope, number of advancing or declining bars, or max advance or decline between two conditions that you specify. The conditions may be unrelated.
The Remember indicator also appears straightforward: it outputs the value of a time series once a condition occurs. The value remains the same until the next occurrence of the condition, when the new value for the time series becomes the output. The power comes with the Remember 2, 3, or 4 versions of the indicator. Now the indicator remembers a time series value based on one condition and can switch to a second time series when a different condition is met. The result is an adaptive value which may be used in other indicators, predictions, or trading strategies. Programmers call this a variable and a lot of users have been asking for one to use in NeuroShell Trader. Now you can create one without any programming!
Advanced Indicator Set 3 also includes a group of indicators that are extremely useful for pair trading models.
Click here to learn more. look for Advanced Indicator Set 3 under the Ward Systems Group add-ons.