
January 15, 2019
IN THIS ISSUE
HOW YOU MIX TIME FRAMES CAN IMPACT YOUR PROFIT
_____________________________________________________________________________________________________
HOW YOU MIX TIME FRAMES CAN IMPACT YOUR PROFIT
Indicator Wizard Tips
The NeuroShell Power User’s ability to mix time frames in a single chart lets your model generate trading signals based on longer term indicators, predictions or trading rules compared to the bar frequency you are trading. For example, you can have an indicator based on hourly data as part of trading rules or predictions in a 15 minute chart and possibly prevent unnecessary trades when the data is noisy.
The equity curves displayed at the bottom of our example chart below show that knowing the difference between a MAX(1 HOUR HIGH,4) and a 1 HOUR MAX (1 HOUR HIGH, 4) can make you money.
What’s the Difference?
There are two different methods to incorporate this long term view into a smaller time frame chart.
The yellow dots are calculated on the hour while the blue dots are calculated every 15 minutes.
Step 1: The Setting at the Beginning of the Wizard
In our 15 minute chart for SPY, we have added two MAX high indicators that use hourly bars in the calculations.
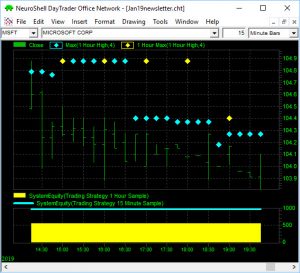
The Max yellow dot indicator is calculated once an hour. The MAX blue dot indicator is calculated every 15 minutes and repeats the same value for 4 bars. The difference is the setting that appears at the beginning of the indicator wizard.
In the example chart the indicator that is calculated every 15 minutes produced a larger equity curve (blue line).
Let’s take a closer look. When you start the indicator wizard, you are asked to “Select the indicator frequency”. This setting controls how often the indicator is calculated.
If you select Option A below, “Same frequency as chart”, on a 15 minute chart the indicator will be calculated every 15 minutes. In our SPY chart, this is the setting we used for the blue dot version of the MAX indicator. You’ll see four blue dots that display the same value, which is correct because the indicator is using 1 hour bars and the MAX value remains constant for the entire hour.
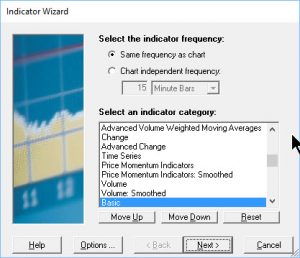 Option A: The same frequency as chart indicator created the blue dots for the MAX value of hourly
high bars over 4 periods. The output is displayed every 15 minutes.
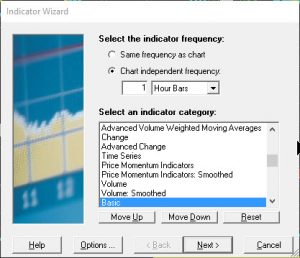
Option B: Indicator frequency independent of chart produced the yellow dots for the MAX value of hourly high bars over 4 periods. The output is displayed every hour.
If you choose Option B for Chart Independent Frequency for 1 hour bars, the indicator will only be calculated once an hour and will be displayed like the yellow dots on our Spy chart.
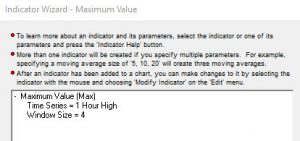
Step 2: The Data Stream
In Step 2 of the Indicator Wizard you choose the data stream for the time series used to calculate the MAX value. In both options the Time Series was set to the 1 Hour High.
Which One is Correct?
If you want to determine whether to enter a trade every 15 minutes, you should use the MAX indicator that is calculated every 15 minutes (the blue dots). The second method of calculating the indicator only every hour may be more appropriate for other types of trading systems such as using multiple input indicators like arithmetic and rule indicators where you can compute, compare and contrast values from different time frames. In the end, the decision is up to you.
https://nstsupport.wardsystemsgroup.com/support/files/Jan19newsletter.zip to download our example chart. You need to own the NeuroShell DayTrader Power User to open the chart.
Other Considerations When Mixing Time Frames
When you want to use indicators, predictions or trading rules based on a different time frame than the base chart, you first have to decide which time frame to use for that base chart. If you’re using a daily indicator to enter a trade on a smaller time frame chart, how do you prevent an immediate re-entry on the same day? For the details, check out our January 2017 Newsletter by clicking here.
For additional insight on building charts with different data frequencies, read the article “The Mechanics of Multiple Data Frequencies in Power User Versions” by NeuroShell Trader lead developer Denham Ward.