
Each bar of a range bar represents trading activity for the user-specified minimum price range. Each bar is created by accumulating trades until the desired high-low range is reached. The first trade to break outside that range starts a new bar. When prices are moving up and down smoothly and the range bar is set to a multiple of the minimum price tick, the high-low range of each bar will equal the specified range.
However, when price is not moving smoothly and large price gaps are occurring, calculation of range bars is not as straightforward and the graph will show range bars whose range exceeds the user-specified minimum price range. When price gaps occur, NeuroShell Trader does not insert phantom bars or phantom trades to create equal size range bars. To do so would introduce extra bars and/or price points that didnt actually exist in real life, but would appear to exist to the calculations done by indicators, predictions and trading strategies, resulting in unrealizable indicator signals and historical trading performance.
Since price gaps are not filled with phantom bars or phantom trades, the high-low range of a bar can exceed the specified range when prices gap outside the range. The first trade that gaps outside of the range prior to the range criteria actually being met, will be placed into the existing range bar so that the minimum range criteria is met or in this case exceeded. That first trade will then cause the range bar to have a high-low range larger than the user specified range. Because the prior range has been exceeded, the 2nd trade will then automatically start a new range bar no matter what its price value is. To do otherwise would allow additional ticks to be added to a bar whose range was exceeded, which contradicts the purpose of a range bar.
An important point to note with regards to range bars is that range bars can vary from data provider to data provider depending upon the granularity of ticks being provided. Although some data providers provide every trade tick that occurs, others may provide “pseudo” ticks which are meant to approximate incoming ticks and price movement but dont actually capture every single incoming tick. The net result is that in fast moving markets, processing every incoming tick may allow a smooth transition between price levels whereas pseudo ticks will likely have more gaps across price levels resulting in more irregular range bars. Of course, in extremely fast markets, its entirely possible for gaps to occur between ticks even when every single tick is being processed, so even data providers that provide every tick could show range bars with larger than expected ranges.
To really make sense of the above, the tick action needs to be followed. Take the following examples:
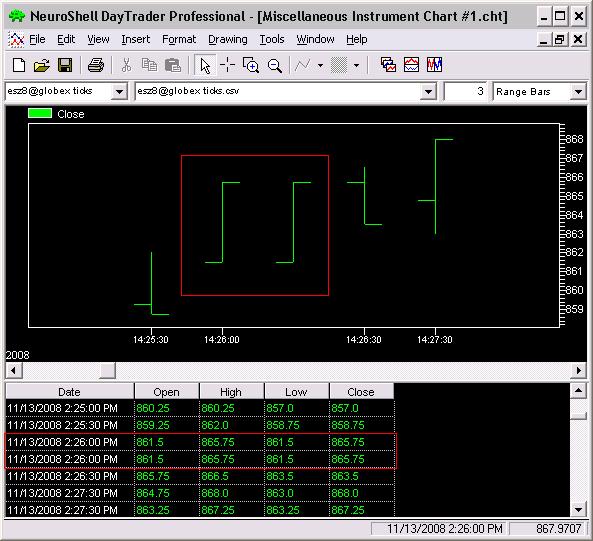
One might question how two sequential range bars with the SAME values could be produced. If you follow the tick action, you can get a clearer picture:
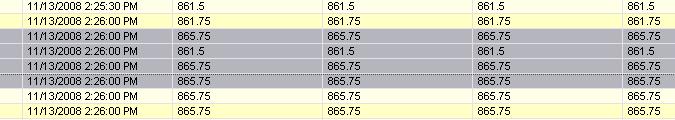
Looking at the gray highlighted rows above, the first gray highlighted row set the range of the “forming” range bar to 4.25 (865.75 minus the current low of 861.50). Since the defined range of 3 has now been surpassed, the next tick that comes in, no matter what value it is, will cause the “forming” bar to complete with the last tick value that came in (865.75) and start “forming” a new range bar with its value (861.50, the second gray highlighted row above).
The next tick that comes in (third gray highlighted row above) is again, 865.75. The current “forming” bar has a low of 861.50, so again, the “forming” bar range is 4.25, surpassing the defined range of 3. So, the next tick that comes in is going to cause the “forming” bar to complete with the last tick value (865.75) and then start “forming” a new range bar with its value (865.75).
As a final note to this document, pertaining to specifically eSignal and IBFeed, in many cases, especially the particular example above, one cannot make a direct comparison as to why eSignal may have different 3 range bars than what was produced using IBFeed. The reason being is that eSignal sends more ticks over a defined time frame than IBFeed does. If you were to compare the number of ticks over a time frame, say 1 minute, between eSignal and IBFeed, you would find that the number sent by eSignal is higher, maybe much higher. As such, you can then have larger price movements in IBFeed. Additionally, there are two different settings in IBFeed, which control how ticks are sent. The default, of IBREALTIMEBAR, is to send ticks simulated from 5 second bars using the number of trades that occurred within that bar. The other option, IBTICK, uses IB’s ticks, but they are rate limited, meaning that the frequency they are sent out is not as high as eSignal. Consult the IBFeed help file for more details on how IB and IBFeed construct and build tick bars.
Note that more frequent ticks does not mean that better models can be produced.Usually sampling (which is essentially filtering) produces a BETTER model. In addition, too many ticks can overwhelm the computer’s memory, and greatly slow down incoming bars. In a fast moving market, eSignal can fall behind IBFeed as NeuroShell attempts to process all of those ticks. If you are using eSignal you are urged to use larger tick bars, and zoom in on only the most recent data if you want to have a chance of keeping up.