
December 18, 2018
IN THIS ISSUE
INCREASE PROFITS WITH POSITION SIZING
THE SAME ACCOUNT BALANCE CAN EARN
ADDITIONAL PROFITS WITH OPTIMAL POSITION SIZING
To show you the difference between a Trading Strategy that trades a fixed number of shares compared to
more advanced techniques that are available in the Trader Power User versions, we started with a single
trading rule based on the Money Flow Index (MFI). This indicator is a volume weighted form of Relative
Strength Index. The MFI uses an average of the days Open, High, Low, and Close instead of just one price
stream. The MFI ranges between values of 0 and 100. The closer the index is to 100, the more positive the
money flow. The closer the index is to 0, the more negative the money flow.
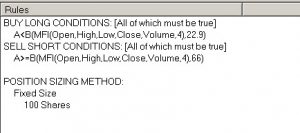
The Trading Strategy is a reversal system that compares MFI to a threshold value in both systems. The
Long Entry threshold could range between 20 to 30; Short Entry values could range between 60 to 100.
The Trader optimizer found these rules for trading 100 shares.
 The Trader optimizer found the above rules for trading 100 shares.
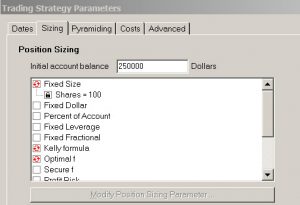
Trading Strategy #2 let the optimizer choose the best position sizing method from a list that included a fixed
number of shares, the Kelly formula and Optimal f.
Position sizing options appear on the Sizing tab of the Trading Strategy Parameters
screen.
Kelly formula: Buys the number of shares/contracts/units that risks the fraction of account equity per
trade calculated by the Kelly Formula, which takes into account the systems history of winning and
losing trades. Risk per trade is the size of the initial protective stop or the largest historical trade loss
when a trade has no initial protective stop. Note that the Kelly Formula can result in suggesting 0 or negative shares/contracts/units be traded for a strategy with a losing history, in which case NeuroShell Trader simply uses one share/contract/unit for trading to reduce risk to a minimum level.
Optimal f: Buys the number of shares/contracts/units that risks the fraction of account equity per
trade calculated to maximize the systems end profit. Risk per trade is the size of the initial protective
stop or the largest historical trade loss when a trade has no initial protective stop. This method was
developed by Ralph Vince.
Note that the Trader Power User versions offer 12 different position sizing methods in addition to the three
methods included in Trader Professional. For details on the different methods, click here.
For Trading Strategy #2 the optimizer chose Optimal f as the position sizing method.
The initial account balance for both systems was $250,000. As trades occur, the initial balance is adjusted
by profit/loss for each trade. The Trading Strategy can buy fewer than the number of shares specified if the
account balance is low. If the account balance drops below the amount to buy a single share, contract or lot,
the Trading Strategy will no longer make actual trades and will show trades of zero size.
Note that while the two trading strategies represent different relative share sizes, both were profitable not only
in the training data (gray bars) but also in the out-of-sample data (green bars). The equity graph is reset at
the start of the out-of-sample period and continues to rise upwards.
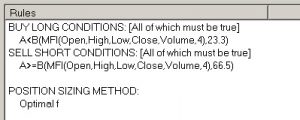 For Trading Strategy #2 the optimizer chose Optimal f as the position
sizing method.
We encourage you to experiment with the different position sizing methods to see how it can impact your
trading systems.
https://nstsupport.wardsystemsgroup.com/support/files/Dec18newsletter.zip to download the example chart.