
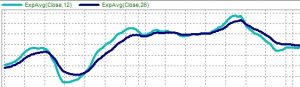
Many trading systems rely on one indicator crossing over another such as a Gerald Appel’s system where a fast 9 period exponential moving average crosses over a 26 period exponential moving average. The signals are easy to spot in the 15 minute bars below.
What Happens When You Add a Second Time Frame for Confirmation?
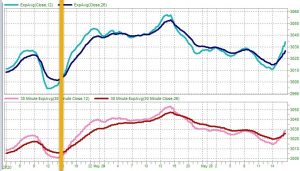
When you add the same crossover to 30 minute bars , you can again see a crossover, but if you look at the yellow line the crossovers for the 15 and 30 minute bars don’t occur at exactly the same time.
How Does This Affect Your Trading Rules?
When you use the Cross Above indicator for the 12 Period Exponential Moving Average crossing above the 26 period moving average for the Long Entry rule, it generates a one bar trading signal.
When you look at the 15 minute signal in blue and the 30 minute signal in pink, the crossovers don’t line up.
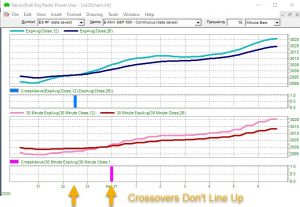
If you created the Long Entry condition below, it would not trigger and you would miss the trade.
BUY LONG CONDITIONS: [ALL OF WHICH MUST BE TRUE]
Cross Above (ExpAvg(Close, 12), ExpAvg(Close, 26))
Cross Above (30 Minute ExpAvg(Close, 12), (30 Min ExpAvg(Close, 26))
Look What Happens When You Switch Indicators
Relational Indicators to the Rescue
Have you checked out the Relational Indicators in NeuroShell Trader? This indicator category includes indicators such as A > B or A < = B.
Many users avoid that indicator category because it reminds them of math class rather than a technical indicator.
However, when you’re examining the relationship of one indicator compared to another in different time frames, relational indicators produce a signal the entire time the condition is true, rather than a single trading signal only when the condition is initially true.
When you add the following relational rules, you get the chart below.
BUY LONG CONDITIONS: [All of which must be true]
A>B(ExpAvg(Close,12),ExpAvg(Close, 26))
A>B(30 Minute ExpAvg(30 Minute Close,12),30 Minute ExpAvg(30 Minute Close,26))
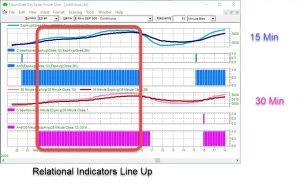
Note that the 15 minute relational indicator (in blue) and the 30 minute relational indicator (in pink) produce multiple bars while the condition remains true.
This time, when you create Long Entry conditions such as 2 of the following must be true, you have a much greater chance of generating a trading signal that is true for both time frames.
https://nstsupport.wardsystemsgroup.com/support/files/Jul20newsletter.zip to download the example chart.
Additional Resources:
The Mechanics of Multiple Data Frequencies in Power User Versions
Multiple Time Frame Analysis in the Real World