
March 22, 2017
IN THIS ISSUE
OPTIMIZE DATA SERIES IN ADDITION TO INDICATOR PARAMETERS
TECH SUPPORT: ADVANCE/DECLINE DATA AND INDICATORS
OPTIMIZE DATA SERIES IN ADDITION TO INDICATOR PARAMETERS
If you own NeuroShell Trader, it is possible that you’ve only used a fraction of its power when it
comes to building a rule based Trading Strategy. Here is how to amp up the power.
When you are creating a trading rule such as Crossover Above, the crossover condition is
calculated using a time series in addition to the number of average periods. When you are setting
the optimization ranges, note that the Time Series Search Space includes a red optimization symbol
as well as the average periods in the example below. This means that you can add more than
one time series (price, indicator or other instrument data) to the trading rule and let the
optimizer decide which one to use.
IMPORTANT NOTE: If you want to optimizer to choose the time series, be sure to add any relevant
data to the chart BEFORE building the trading rule. This will allow you to select multiple data
streams from the list of existing data on the chart.
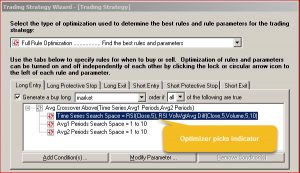 For this example we selected both the RSI and RSI VolWgtAvg Diff indicators for the time series search space.
We created a reversal system using the Avg Crossover Above indicator for the Long Entry rule and
the Crossover Below rule for the Short Entry. For both rules we let the optimizer select between the
RSI and RSI Vol Wgt Avg Diff indicators for the time series, along with the number of average
periods.
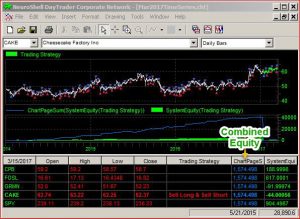 The results for the entire portfolio showed a $1,574.50 profit.
The optimizer chose different times series for each stock in the portfolio. Many times a
different time series was picked for the Long and the Short trading rules for the same
stock.
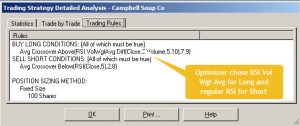 The Campbell Soup model chose the RSI Vol Weighted Average for the Long rule and the regular RSI indicator for the Short. Other stocks in the portfolio used different combinations of the two indicators.
https://www.nstsupport.wardsystemsgroup.com/support/files/Mar17Newsletter.zip to download a copy of this chart.
ADVANCE / DECLINE DATA STREAMS AND INDICATORS
–Check with your datafeed for availability
NeuroShell Trader includes three indicator categories called Market
Advance/Decline, Market New High/New Lows and Market Volume
Advance/Decline. The indicators include variations on ratios, spreads, and
thrust indicators that may be useful in adding market direction information to
your trading model.
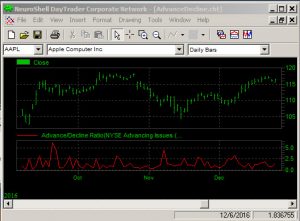
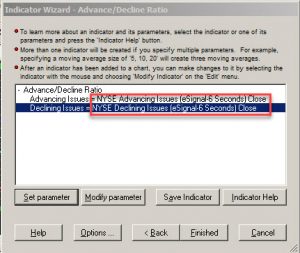
The Advance/Decline Ratio indicator is computed with index data such as NYSE Advancing and Declining Issues supplied by ESignal. Similar data is available for other exchanges.
The Advance/Decline Ratio indicator is computed with index data such as NYSE Advancing
and Declining Issues supplied by ESignal. Similar data is available for other exchanges.
When adding these indicators to a chart, you are required to select a data stream for both
advancing and declining issues. In eSignal, Advancing and Declining data streams for different
exchanges are listed under Indexes and may be inserted as “Other Instrument Data” if you are
building a stock chart.
Check with your data provider to determine if they supply data streams for
advancing and declining issues for different exchanges.