
“Trading IBM Intraday” by Dennis Meyers made use of the Meixner polynomial. The complete mathematics of the Meixner polynomial wasn’t divulged in the article or the author’s previous article in Volume 16: December. The average reader will be hard pressed to do the mathematical research necessary to reproduce the Meixner polynomial prediction of the next bar. Therefore, to predict the next price bar, we used a tool already widely available to this magazine’s readers in a number of software products – a neural net. Since neural nets already weight their inputs adaptively, the fading of appropriate past points on the curve is automatic.
Instead of predicting the price curve, we predicted the price change (momentum) curve, feeling that price change is more normalized over time than price.
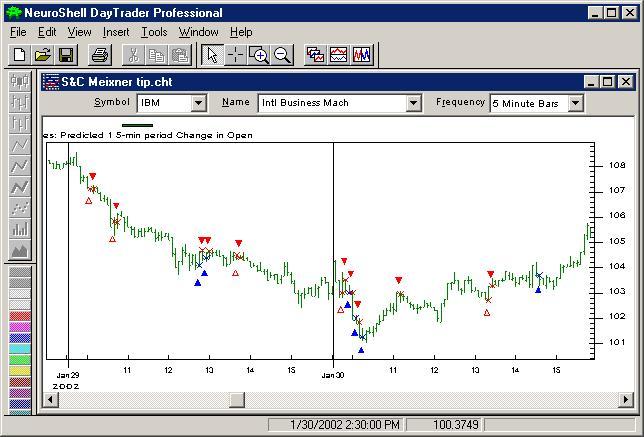
We built a neural net whose inputs were the last 4 price changes, and asked it to predict the next price change. We used the NeuroShell Trader’s default neural net trading rules – buy when the prediction exceeds a certain threshold, and sell when the prediction is below a threshold. We also used the Prediction Wizard’s walk forward capability and built-in optimizer to find the proper thresholds over the one month period prior to the one week out-of sample period, just as the author did. Training of the net also took place during the month prior to the out-of-sample period.
Unlike the author, however, we felt it was more realistic to include commissions, so we assigned an $8 commission to each trade entry or exit. For the one week period from 1/25/02 through 2/1/02, our model netted $10,630 after paying commissions compared to the Meixner polynomial net of $6,040 before paying commissions. This was accomplished on 20 trades, where 85.7% of the shorts were profitable and 66.7% of the longs were profitable. The maximum number of consecutive winners was 10, and the maximum number of consecutive losers was 1.
Since the “fading memory” of the Meixner polynomials is one of their key features, we wanted to see how the neural net “faded its memory”. The Prediction wizard reported the following contributions for its inputs:
Time t price change – 16.22%
time t-1 price change – 37.47%
time t-2 price change – 41.53%
time t-3 price change – 4.78%
Thus the neural net determined that fading should not occur until the fourth bar back (we used 5 minute bars), and that memory should actually be sharper until then!
We agree with the author that walk forward testing is important. The NeuroShell Trader’s Prediction Wizard allows many walk forward tests. It should also be noted that the model we built for IBM can almost automatically be applied and retrained for many other stocks or commodities with the Add/Remove chart pages facility.
File Download
https://nstsupport.wardsystemsgroup.com/support/files/tip0602IBM.exe