November 6, 2019
IN THIS ISSUE
Mixing Timeframes Can Eliminate Noise in Trading Systems
Planning time business concept or wasting minutes as a group of clocks shaped as a human head as a health symbol for psychology or scheduling pressure and dementia or aging as a 3D illustration.
If you want your trading model to check for signals every five minutes but want to eliminate noise driven trading mistakes by feeding the model 15 minute indicators, the NeuroShell DayTrader Power User version is the best tool for the job.
You can display different data frequencies such as 1 day, 2-hour, 3 minute and 0.25 range bars on the same chart, and you can incorporate different frequencies in a single calculation, prediction or trading rule.
Question 1: Chart Frequency
When Mixing Time Frames, What Time Do You Use for the Chart?
Do you create the chart to accommodate the longer term time frame such as a 15 minute RSI indicator, or do you select the frequency that matches how often you want your model to check for signals.
We suggest creating a chart that matches the frequency of trading signals that you wish to monitor. In our example chart, we want to check for signals every 5 minutes. We’ll call this the time frame of the base chart.
Question 2: What Happens When the Data Doesn’t Line Up?
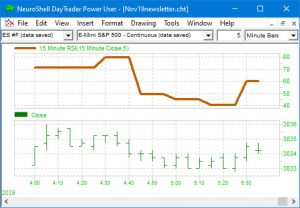
A 15 Minute RSI Indicator Displayed on a 5 Minute Chart

If you add data of a different frequency than the base chart, it will display with more or less data points than the original chart data. In our base 5 minute chart, notice that the 15 minute RSI indicator displays the same value over 3 of the 5 minute bars and a new RSI value appears on every third 5 minute bar.
But what happens when the bars are not multiples of a time bar, such as when a range or volume bar is added to the chart. What value is used in a calculation?
When the inputs are all the same frequency as the indicator, prediction or trading strategy output, then the data timestamps all line up and calculation proceeds as expected. However, when the input frequencies are different than the output frequencies and don’t line up in timestamps, the calculation uses the last available data value for each particular input.
Question 3: How Do the Rules Work?
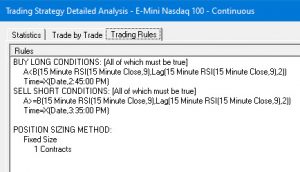
For our base 5 minute chart , the Trading Strategy would use the last available value of the 15 minute RSI indicator and optimize the time in 5 minute increments. The final trading rules are displayed below.

Question 4: What Are the Results?
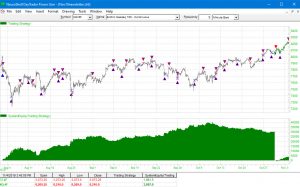
The chart produced profitable signals in the trading (out-of-sample) period for both the NASDAQ and S&P 500 E-Minis.

