
Dennis Peterson’s Fibonacci and Gann Projections article was built “to
predict future turning points – that is pivot peaks and valleys.” However
NeuroShell Trader Professional has an inexpensive add-on already to do just
that. We will use the peak and valley probability indicators from our Turning
Points Add-on.
After installing the Turning Points Add-on, you can insert the Peak and
Valley Probability indicators by following the instructions below:
1. Select ‘New Indicator …’ from the ‘Insert’ menu.
2. Select the Turning Points category.
3. Select the PeakProb, ValleyProb, and TPplot indicators.
4. Select the Neighborhood and Window Size as you desire.
The Peak Probability and Valley Probability indicators use the mean and
standard deviation of the percent change in value from peak to valley or from
valley to peak. Once these two characteristics of the percent change are known
in the lookback window, it is possible to compute the probability that the most
recent bar is at a new peak or at a new valley. The Turning Points Add-on
algorithm does not just blindly search for the first consecutive valley after a
peak (or a first consecutive peak after a valley). It tries to optimize on
turning points and locates such peaks and valleys that a human expert would
choose by looking at the chart.
In addition to probabilities based on percent change, the Turning Points
Add-on includes indicators to provide probabilities for peaks and valleys based
on horizontal change (bars), as well as many other statistical measures.
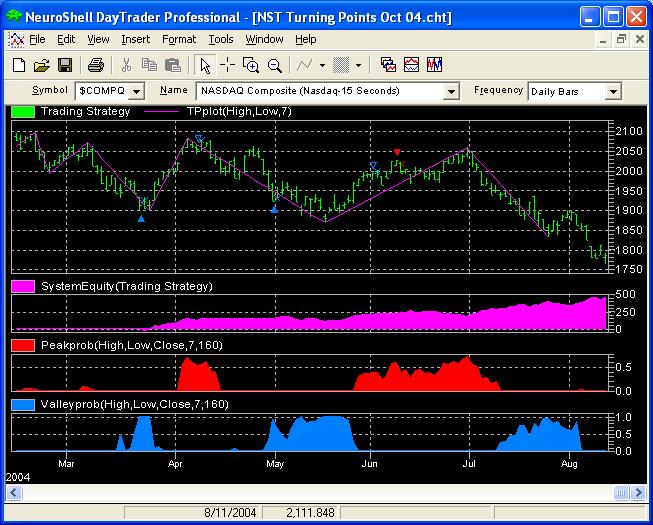
The TPplot indicator may be used as a visual aid for peak and valley
locations on the chart. It connects consecutive TPs with straight lines.
You can automatically backtest the usefulness of the Peak and Valley
Probability indicators by inserting them into a Trading Strategy as follows:
1. Select ‘New Trading Strategy’ from the ‘Insert’ menu.
2. On the Long Entry tab, select the Add Conditions button, Relational category,
A > B.
3. Set A = Valley Prob and B = 0.5.
4. On the Long Exit tab, select the Add Conditions button, Relational category,
A > B.
5. Set A = Peak Prob, and B = 0.5.
6. On the Short Entry tab, select the Add Conditions button, Relational
category, A > B.
7. Set A = Peak Prob, and B = 0.5.
8. On the Short Exit tab, select the Add Conditions button, Relational category,
A > B.
9. Set A = Valley Prob and B = 0.5.
The genetic algorithm optimizer in the NeuroShell Trader can find the most
profitable settings, including B above as well as the neighborhood and window
size. This can provide you with your own custom version of the Peak and Valley
Probability indicators which best works with your market sector.
Using the NeuroShell Trader’s ability to backtest and out-of-sample paper
trade, you can get complete statistical reports on the success of Peak and
Valley Trading Strategies.
The example above is but a very simple use of two the many indicators in the
Turning Points Add-on. For example, you can add Fibonacci retracement levels
using the Fibonacci Retracement indicator. Far more complicated strategies can
be built, and the indicators make great inputs to our neural networks, enabling
non-linear predictions of turning points.
File Download
https://nstsupport.wardsystemsgroup.com/support/files/tip1004.exe