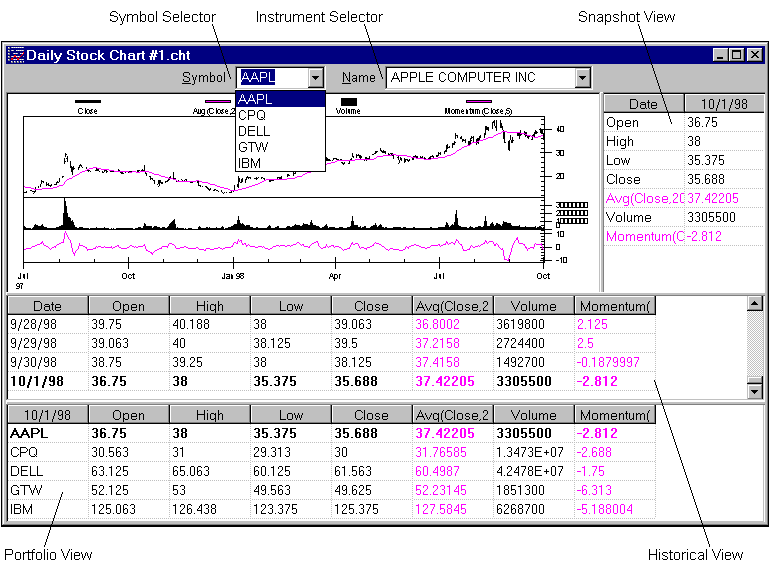
This is an example of what a chart looks like. The annotated features are described at the bottom of the page.
Symbol Selector – Drop down list that allows switching between chart pages. Refer to Viewing a Different Chart Page
Instrument Selector – Drop Down list that allows switching between chart pages. Refer to Viewing a Different Chart Page
Chart View – Displays the data in a graphical format (Chart View).
Snapshot View – Displays the data values for a specific date for the selected Chart Page (Snapshot View).
Historical View – Displays the data values for all of the data on the current chart page (Historical View).
Portfolio View – Displays the values for a specific date for all of the Chart Pages in the chart (Portfolio View).
