
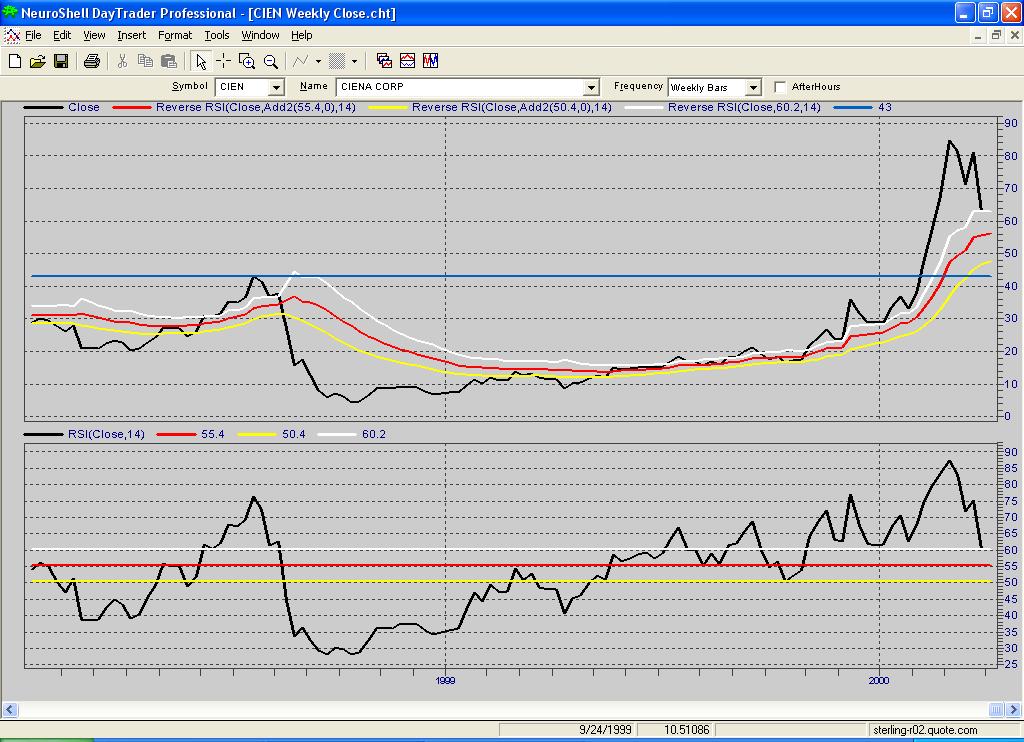
Giorgos Siligardos’ Decomposition method basically uses three indicators – the RSI, the Reverse Engineering RSI, and horizontal support and resistance lines.
The RSI is a standard indicator in NeuroShell found in the Price Momentum category.
Siligardos also makes use of horizontal lines, which may be inserted with the following procedure:
- Select the Arithmetic Indicator category.
- Select the Add2 Indicator. Add the desired value plus 0 to graph a horizontal line on the chart.
The Reverse Engineering RSI indicator may be created using the NeuroShell Trader’s ability to call external programs. These
programs may be written in C, C++, Power Basic, and Delphi. We’ve created the Reverse RSI custom indicator that you may download
from the NeuroShell Trader free technical support website. (Note: This is the same indicator that was created for the tip for
Siligardos’ June 2003 article.)
After downloading the Reverse Engineering RSI indicator you can insert it by following the instructions below:
- Select ‘New Indicator …’ from the ‘Insert’ menu.
- Select the Custom Indicator category.
- Select the Reverse RSI indicator.
- Change the value of Close to High, Low or Close as appropriate according to the article.
- Select the Future RSI Value and Wilder Time Periods as the article indicates.
We might suggest that the parameter Future RSI Value might be better determined by our genetic algorithm (GA) optimizer
instead of the “eyeballing” method implied in the article. Simply insert buy and sell rules in a Trading Strategy which buy and
sell based on price proximity to or crossovers of the values of the Reverse RSI Indicator.
File Download
https://nstsupport.wardsystemsgroup.com/support/files/tip0904.exe