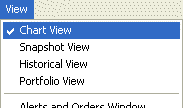
Viewing the enables you to graphically view your data. To select the follow the steps below:
- Select the chart on which you wish to see the
- Select from the View menu.

To hide the deselect the from the View menu.
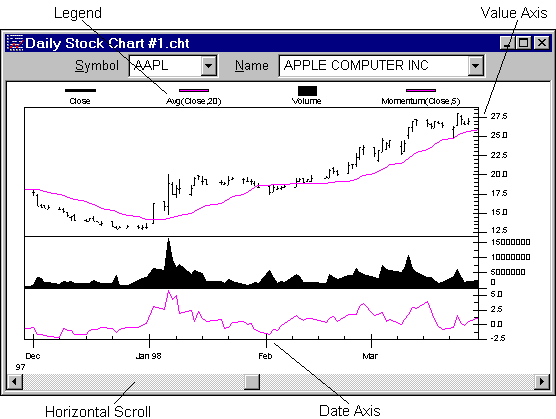
This is an example of what a looks like. The annotated features are described at the bottom of the page.
Legend – The graph legend provides a description of the charted data series. The Legend text may be clicked on to select the desired series.
Value Axis – Axis that shows the numeric range of values for each subgraph.
Date Axis – Axis that shows the date range of graphed data series.
Horizontal Scroll – Scroll bar that allows you to move to a different set of dates when zoomed in on a smaller area than the entire data series in your data file. To make small moves use the arrows at either end of the Scroll bar. To make larger moves click area between gray box and arrows at either end of the Scroll bar.
