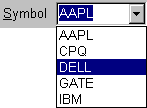
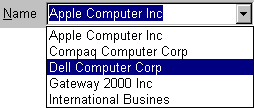
Viewing a different chart page can be very useful if you are applying your data to multiple instruments and want to see the results of your analysis on the other instrument(s).
You may view a different chart page by:
- Selecting a new ticker symbol from the first drop down list at the top of the chart

- Selecting a new instrument name from the second drop down list at the top of the chart

- Selecting the instrument in the Portfolio View (if the Portfolio View is being viewed).
Tips:
- To view a new chart page you may type the ticker symbol in the first drop down list at the top of the chart.
- To view a new chart page you may type the instrument name in the second drop down list at the top of the chart.
