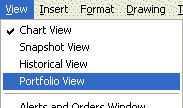
The displays the data values for a specific date for all of the Chart Pages in the chart. In order to see the follow the steps below:
- Select the chart on which you wish to see the .
- Select Portfolio View from the View menu.

To hide the deselect the Portfolio View from the View menu.
If you click on a ticker or its data in the Portfolio view, the current Chart Page changes to the selected ticker.
Notes:
- The Trading column only shows trades until they are filled. It does not indicate the current position. In order see the current position you will need to insert a new “Position” indicator from the “Trading Strategy: Position Information” category.
- The data that is displayed in red is most likely data that has not yet completed it’s time period. This means that if you have a 5 minute chart that the red data shown in this view is for data that is within those 5 minutes, but the 5 minute period has not completed. The only exception to this is if you have manually selected the color of a time series to be red.
