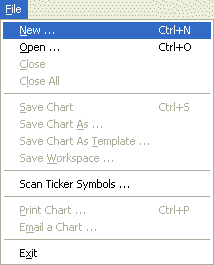
Creating a new chart allows you to start a new problem, to which you will be able to add indicators, predictions, trading strategies, and other instrument data that will help you make trading decisions.
Following the procedure below activates the chart wizard, which guides you through the process of creating a new chart.
-
Select
 from the toolbar or New ‘ from the File menu.

Note:
- You may have multiple charts displayed at any one time by simply creating more than one chart or opening more than one existing chart.
