Changing the line style or color will allow you to view the data the way you want. In order to distinguish indicators and/or predictions you may select different line styles and/or colors to your liking.
- Select a data series on the chart by clicking on the corresponding line, legend text, or Snapshot View text.
- Once the data series is selected (highlighted with black boxes), change the line style and color by using the style and color dropdown icons on the toolbar.
-
Press the style/color displayed on the toolbar if that is the desired style/color. The style or color displayed on the toolbar is the last style or color set and provides a means of quickly changing a large number of data series to the same style/color.
-
Press the small down arrow and click on the desired style or color. An indented box notates the current style or color of the selected data series.
- To deselect the data series, simply click on the selected data series again or click on a blank area of the chart.
![]()

or
- Select the data series you wish to format by right-clicking the mouse button on the corresponding line or legend text.
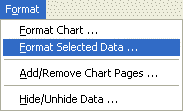
- Select Format Selected Data ‘, Format Selected Indicator ‘, Format Selected Prediction ‘, Format Selected Trading Strategy ‘, or Format Selected Alert ‘ from the pop-up menu, depending upon the type of data series you are selecting.
- Change the style and color using the Format Data Series interface. Note that the Format Data Series interface provides advanced formatting options, such as gradient coloring, that are not available on the tool bar.
- To deselect the data series after using the Format Data Series interface, simply click on the selected data series again or click on a blank area of the chart.

Troubleshooting:
- You must make sure the mouse cursor has changed to a hand before clicking on the line or legend text. If the cursor is still an arrow or a cross hair, the selection will not occur. If you are selecting a line on the chart, it is best to position the cursor over a data point instead of the portion of the line that connects two data points.
