
April 14, 2020
IN THIS ISSUE
Increase Profits If You Know When NOT to Trade
InterChart Tools TradeGate Add-on for NeuroShell Trader
Background
For any dataset and algorithm combination there is only one ideal volatility. That doesn’t mean that you have a guarantee of profit. It just means that at some level of volatility, your algorithm will deliver its best performance.
Generally, if the volatility gets too wild, your model can’t cope. Your system will signal a trade but the direction will change so quickly that you can’t profit. On the other end of the scale, price is moving so slowly and minimally that there is a balance between the bulls and bears and the balance lacks conviction on both sides. The chart is waiting for one of them to get tired and back off. Then the issue will move but the direction will be set by chance.
You may observe that price volatility and volume volatility have a probable relation with time of day (or day of the month) as well as each other. How to you incorporate that relationship into your Trading Strategy?
The Solution: The TradeGate Add-on
To tilt the odds in your favor Richey Enterprises has created the InterChart Tools TradeGate indicators. These indicators can determine when to block or allow trades for your individual trading system. You can use them in both predictions and Trading Strategies.
The Add-on includes:
Intraday Indicators – Included in the Trader Time Flags Category
Allow Trades by Time of Day indicator allows your Trading Strategy to enter a trade only during the best time of day as determined by equity returned and the optimizer.
Block Trades by Time of Day indicator stops your Trading Strategy from initiating a trade at a time of day which generates more loss than gain.
Daily Indicators – included in the Trader Day & Date Flags Category
Allow Trades by Date and Block Trades by Date
These indicators perform the same function as the intraday versions but trades are restricted/allowed by dates rather than time of day.
We’ll show you how to implement the Time Block indicators with a sample trading system.
Step 1: Build the Basic System Based on Volume Divergence
The Negative Volume Index provides a measure of market direction relative to price level for periods of declining volume. The Positive Volume Index does the same for increasing volume. Both indicators are based on the theory that the buying and selling of smart investors occurs on quiet, declining volume days, while the buying and selling of unsophisticated investors occurs on dramatic, increasing volume days.
The model is centered around the divergence between these two indicators. Divergence is calculated by subtracting the Positive Volume Index from the Negative Volume Index.
We created a one hour chart for the S&P 500 E-Mini. The Trading Strategy is set to trade one contract.
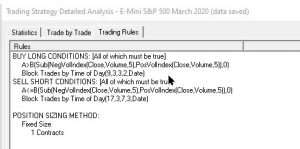
After optimization, the resulting trading rules are as follows:
BUY LONG CONDITIONS:
A > B (Sub (NegVolIndex (Close,Volume, 5), PosVolIndex (Close, Volume, 5)), 0)
SELL SHORT CONDITIONS:
A <= B (Sub (NegVolIndex (Close,Volume, 5), PosVolIndex (Close, Volume, 5)), 0)
Step 2: Find Times When the System Should NOT Trade
To determine the best times to trade the Divergence system, we added TradeGate Block Trades indicators to both the Long Entry and Short Entry tabs in the Trading Strategy wizard.
The original trading rules are locked as seen below, so only the times in the Block Trades indicators will be optimized in this revised Trading Strategy.
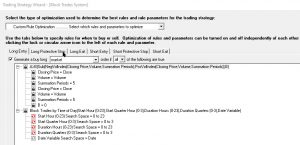
Step 3: Review the Enhanced Rules
The NeuroShell Trader’s optimizer generated the rules listed below. The Start Hour and Start Quarter Hour parameters determine the beginning of the blocked period. The Duration Hours and Duration Quarter Hour parameters determine the length of the blocked period.
For Long Entries, the Block indicator stopped trading from 9:45 am until 1:15 pm. For Short Entries, the Block began at 5:45 pm and continued until 1:30 am.
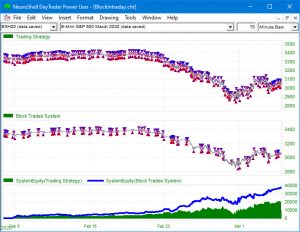
Step 4: Examine the Results
The BlockTrades trading system resulted in a System Equity of $36,899 (blue line) compared to $19,918 for the original system (green line) in the chart below.
Step 5: Next Steps
Cascade Indicators
The indicators may be cascaded. For example, if you want to find not only the best time to buy a security, but also the second best time, you can enter several copies of the Allow Trades by Time of Day indicator in the Long and Short Entry tabs of the Trading Strategy wizard. You can also add several copies of the Allow and Block indicators in a prediction.
Mixing Indicators
If you have an intraday chart, you can use both the Allow Date and Allow Time of Day indicators to determine the best days AND the best times to trade. You can find the least favorable dates/times using the corresponding Block indicators.
The InterChart Tools TradeGate Add-on includes six example charts, including the chart described above.
To learn more about how you can incorporate the TradeGate indicators into your trading systems, https://nstsupport.wardsystemsgroup.com/support/files/InterChartToolsTradeGate.pdf to read the help file.