February 13, 2018
VOLUME INDICATORS THAT FOLLOW SMART BUYERS
An article by Ken Calhoun in the February 2018 issue of Technical Analysis of STOCKS & COMMODITIES touts the advantage of using volume to confirm price action momentum before making a trade. According to Calhoun, “By seeking to trade with the help of correlated technical analysis patterns, you gain a trading edge over less knowledgeable retail traders.”
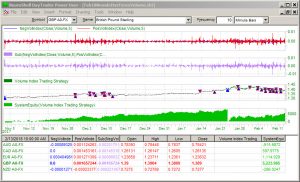
However, during the process of graphing indicators, I took a closer look at the Positive and Negative Volume Index indicators. Checking out the indicator help file, I learned that the Negative Volume Index indicator provides a measure of market direction relative to price level for periods of declining volume. Both of these indicators are based on the theory that the buying and selling of smart investors occurs on quiet, declining volume days, while the buying and selling of unsophisticated investors occurs on dramatic, increasing volume days. Using this theory, the Negative Volume Index should indicate the actions of the smart investors.
The next step involved the creation of an indicator that looked at divergence between these two indicators. I simply subtracted the Positive Volume Index from Negative Volume Index, and then used that value to create trading rules such as:
Trading Rules
A<=B(Sub(NegVolIndex(Close,Volume,10),PosVolIndex(Close,Volume,1)),-0.00273)
I also used a Fixed Size position size of 100,000 units of each currency in the portfolio.

This Trading Strategy used the difference between the Negative and Positive Index Indicators to determine when to trade.
This is just another example of how you can use NeuroShell Trader to quickly test out new trading ideas.
http://www.Nstsupport.wardsystemsgroup.com/support/files/Feb18Newsletter.zip to download the chart.
