The following are the primary new features in the 2.0 release of the Trader:
- New Data Views – There are new data view windows that you can select under the View menu. You can turn on one or several views at a time.
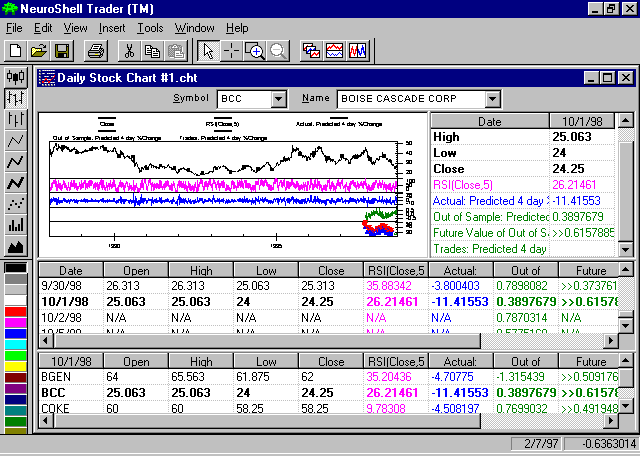
The chart above shows all views at once. These are the new views available:
-
Snapshot view, which replaces the old data view window. If you click on a data series in the Snapshot view, the chart will select/deselect that data series.
-
Historical view, which allows viewing a historical list of buy/sell signals, predictions, indicators, etc., across the current chart page. If you click on a date in the Historical view while in cursor mode, the chart cursor will jump to that date.
-
Portfolio view, which allows viewing buy/sell signals, predictions, indicators, etc., across multiple chart pages. If you click on a ticker or its data in the Portfolio view, the chart changes to that chart page.
- Using Custom Indicators – You can use custom indicators that will be saved in the Professional product. This allows NeuroShell Trader “Solution Providers” to create custom indicators and sell or distribute them to ALL NeuroShell Trader users, even if those users don’t have the Professional product.
- Several New Indicators and Categories
-
16 Adaptive Moving Average variations added (‘Kaufman Adaptive Moving Average’ category)
-
4 new Time Series category indicators: Efficiency, Simple Stochastic %K, Simple Stochastic %D, Simple Stochastic Slow %D
-
1 new Statistical indicator: Random
-
5 new Volume category indicators: Money Flow Index, Positive Money Flow, Negative Money Flow, Resistance to Advances, Resistance to Declines
-
9 new moving average indicators added to appropriate categories: MovAvg Ratio, ExpAvg Ratio, LinWgtAvg Ratio, VolWgtAvg Ratio, VolWgtAvg Offset, VolWgtAvg/Lag(VolWgtAvg) Ratio, VolWgtAvg – Lab(VolWgtAvg), Avg(VolWgtAvg-Lag(VolWgtAvg)), Avg(VolWgtAvg/Lag(VolWsgAvg) Ratio)
-
Volume Accumulation #3 renamed to William’s Variable Accumulation in the Volume Category. Accordingly, all former Volume Accumulation #3 indicators in the Volume:Smoothed Category have been renamed.
-
2 new Crossover indicators: Stochastic %K/%D Crossover Above, Stochastic %K/%D Crossover Below
-
Stochastic Crossover Above and Stochastic Crossover Below renamed to Stochastic %K Crossover Above and Stochastic %K Below, respectively
Note that if you used one of the renamed indicators in an old chart, the old chart will still work properly in the new release.
- New Charting of Predictions by the Prediction Wizard – The Prediction Wizard has been significantly changed regarding the manner in which predictions are displayed. Primarily, since the network can simulate trading during the net training process (even if you train on error minimization), we have modified the program to display the resulting trading information without the necessity of building a trading strategy. You can still build more complicated trading strategies with the Trading Strategy Wizard as usual. As soon as the net is trained, the following are displayed automatically with regard to the period that is the concatenation of all the evaluation periods for all walk-forwards:
-
Full trading statistics and trade-by-trade statistics are displayed in the detailed analysis for predictions.
-
Buy/sell points resulting from the trained out of sample net are now displayed on the graph. These are shown on a separate subgraph with green coloring for the price stream.
-
Prediction results now show a line for the combined out of sample error/profit.
Also, the red current net prediction is no longer shown with the green out of sample prediction line. You can still insert the current net’s prediction, or any walk-forward net’s prediction, if you want to.
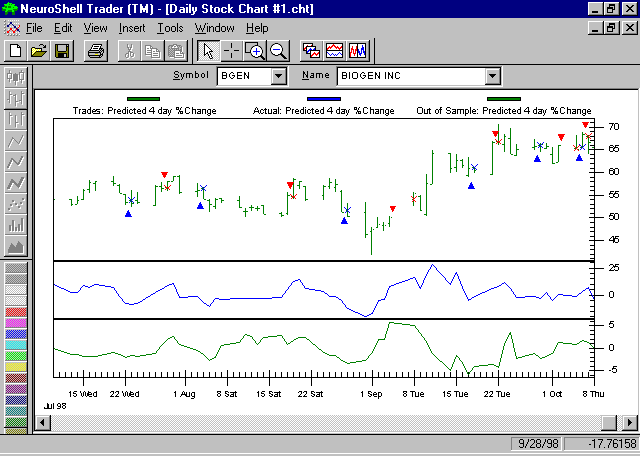
In the chart above, we have just inserted a prediction. The green Trades subgraph was produced by the Prediction Wizard, not the Trading Strategy Wizard (we moved that subgraph to the top so it would be larger).
- In case you do want to build a trading strategy that matches the Prediction Wizard’s results, the following assistance is now available:
-
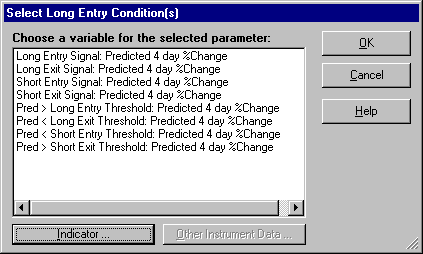
When you select entry and exit conditions, the conditions the net used during training are already set up and displayed for you to choose (i.e., the relational indicator A>B has already been completed for you).
-
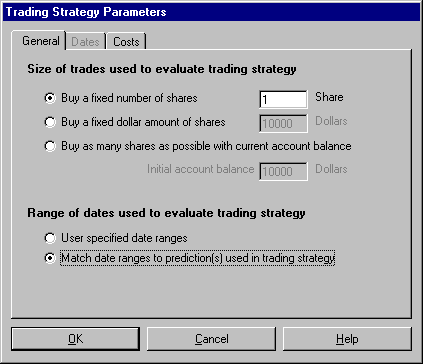
You will have an option to match up trading strategy dates to the out of sample dates for the prediction(s) that were used for the prediction buy/sell signals. This builds a trading strategy that is redundant because you already have buy/sell signals from the net; however, building it may be useful if you want to add more sophistication to the trading strategy.
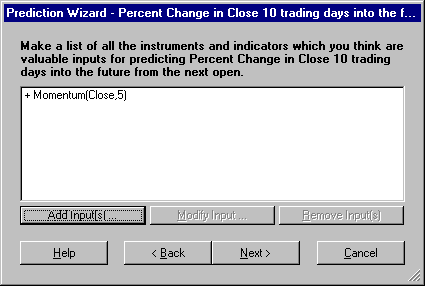
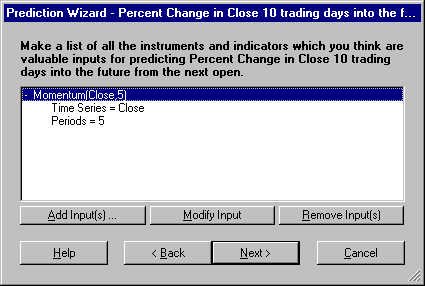
- Expandable Parameter Listing for Prediction and Trading Strategy wizards – When you insert an indicator within either the Prediction Wizard or the Trading Strategy Wizard (as opposed to inserting within the Indicator Wizard), you can now modify the parameters of those indicators easier, even if they are deep within embedded indicators. Each such indicator is preceded by a plus (+) sign you can click on. When you click it, the parameters are listed below. Double-clicking on a parameter allows it to quickly be changed. The plus sign will change to a minus sign, which when clicked, hides the parameters previously listed. See below for example.
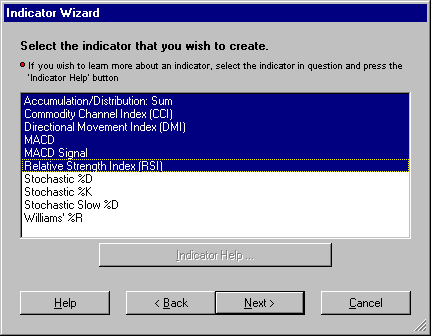
- Multiple Selection of Indicators – Now you can go to an indicator category and select several indicators at the same time, and all will be entered at once.
- TradeStation’ 2000i Support – The new Trader automatically recognizes whether it is talking to TradeStation’ 4.0 or 2000i, and communicates accordingly.
- Carry Forward Retraining – This is a new feature we don’t think anyone else is doing yet (although we are usually copied!) It is also a feature some of our users have asked for. Previously, you trained a net, used it for awhile in trading, and then retrained at some time in the future. When you retrained, the current net and all walk-forwards moved ahead to the present date, and their back-tested history to the present date wiped out the history that you had with your older net(s). Furthermore, you had to be careful when to switch to the new net, because if you were long in the old net, for example, the new net didn’t know that. You had to wait until the old net sold, or adjust the back-test until the new net was long, or something similar, so you could switch to the new net.
Now our Carry Forward Retraining feature makes switching to the new net painless. When you retrain an old net after using it for a while, you will get a dialog box asking you if you want to carry forward, keeping the old net’s results. If you say yes, it won’t switch you to the new net until you download tomorrow. Furthermore, it remembers whether you were in the market or not and whether you were long or short, and keeps you in that same status on the new net. The old buy/sell points don’t change since they’re based on the old net still. The next buy or sell signal you get will be from the new net.
- Nomenclature Changes and the New Options Menu – In previous releases, predictions were charted on the day the prediction would come true, not on the day the prediction was made. This was so that actual and predicted values could both be charted on the day of the actual. Nevertheless, data streams in the Trader used for trading strategies needed the prediction on the day it was made. We used terms like “% Change as predicted 1 day ago” and “% change predicted 1 day into the future” to differentiate these data streams. Some of our users were not comfortable with the predictions plotted when they would come true because they (correctly) think of a prediction as an indicator whose value today is the prediction for x days into the future. Others were perfectly comfortable with our displays, even if they previously used systems that did not “know” about the future. We have therefore given the user control in this release of how these predictions should show up on a chart. We have at the same time renamed predictions to (hopefully) make the concepts clearer and more succinct.
-
In this release there are now “predictions” and “prediction signals”. The prediction is what was plotted before, i.e., “% Change as predicted 1 day ago.” It is plotted on the day it comes true. Prediction signals are indicators giving you the value today that is predicted for the future, previously “% change predicted 1 day into the future.” You get your choice of which one to plot (see 2 below), but the prediction signal is the default. Both can be made available as data streams in the Existing Data/Calculations menu. Only the prediction signal can be used in a trading strategy.
There are three types of predictions, three types of prediction signals, and similar nomenclature for actuals:
Out of sample: 1 day % change
Walk-forward: 1 day % change
Current net: 1 day % change
Actual: 1 day % change
Out of sample signal: 1 day % change
Walk-forward signal: 1 day % change
Current net signal: 1 day % change
Actual signal: 1 day % change
-
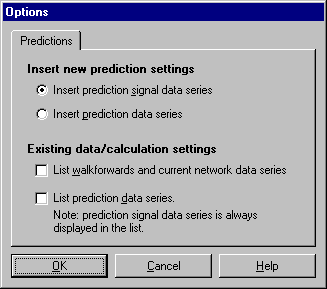
We have added an options dialog that is accessible from the ‘Tools’ menu. This dialog currently allows you to change how a prediction is inserted on the chart. The prediction may be inserted as a prediction signal on the bar the net was fired or as the prediction that extends out into the future. In addition this dialog gives the user control over whether Current nets and Walk-forward nets are displayed in the data lists and whether or not to display the predictions in the data lists (since normally only signals will be needed there for trading strategies.)
- Other Minor Prediction Wizard Changes
-
Change in open and %Change in open have replaced Change in close and %Change in close in the list of default prediction outputs. These new outputs compute the change from tomorrow’s open to the open x bars beyond tomorrow’s open. The prediction enters and exits at the next bar’s open, just as actual daily trading would do. Therefore, this will allow for a more realistic prediction. However, Change in Close and %Change in close are still available by selecting Other Data/Indicators.
-
When predicting a custom indicator output, the prediction wizard displays a ‘…’ button that can be used to modify the parameters of the custom indicator output.
-
The prediction profit will be slightly (depending on the trades) different from release 1.4x because that version did not allow a long exit and short entry (or a short exit and a long entry) on the same bar, as release 2.0 does.
- New Trading Strategy Order Features – Some new trading features have been added. They are somewhat complicated for the beginner and should only be considered by more experienced users.
-
A market on close exit order can exit on the same bar as entry for market, limit, stop, and stop-limit entry orders. Previously, only a market order could exit on the same bar as a close exit order. For example, this allows for very limited day trading: predict the low and use a limit order to enter on the predicted low, while exiting at the close on the same day.
-
The trading strategies now allow a trailing stop reversal trading strategy. If you specify only a long trailing stop and a short trailing stop, the strategy will reverse between long and short positions using trailing stops to enter/exit each position.
-
When using a long/short entry reversal system (i.e. only long and short entry conditions) and stop/limit/stop limit orders, the system now exits with the same type of order as it enters. Previously if the system was long and the short entry condition became true, the system would exit the long position with a market order and place the short entry order with the desired order type (stop/limit/stop limit). Now the system will exit the long position with the same type of order as will be used for the short entry. This eliminates the problem in which there’s an exit on the next bar’s open, but the entry is some time later that bar or perhaps even an indefinite number of bars later depending upon the limit/stop prices involved.
- The following trading strategy position indicators have been changed to more accurately reflect their meaning:
-
Bars Since Entry Activated:
-
Parameter has changed from Positions ago to Activations ago (0 Positions ago should now be 1 Activation ago).
-
Values now reflect activations that may not have been filled (i.e., the limit price was never reached), as well as activations that were filled.
-
Bars Since Entry Filled:
-
Parameter has changed from Positions ago to Fills ago (0 positions ago should now be 1 Fill ago).
-
Bars Since Exit Activated:
-
Parameter has changed from Positions ago to Activations ago (0 Positions ago should now be 1 Activation ago).
-
Values now reflect activations that may not have been filled (i.e., the limit price was never reached), as well as activations that were filled.
-
Bars Since Exit Filled:
-
Parameter has changed from Positions ago to Fills ago (0 Positions ago should now be 1 Fill ago).
-
Bars Active:
-
Properly handles reversals – still represents the number of bars active in the current position or any previous position.
-
Bars Filled:
-
Properly handles reversals – still represents the number of bars filled in the current position or any previous position.
-
Value when Entry Activated:
-
Parameter has changed from Positions ago to Activations ago (0 Positions ago should now be 1 Activation ago).
-
Values now reflect activations that may not have been filled (i.e., the limit price was never reached), as well as activations that were filled.
-
Value when Entry Filled:
-
Parameter has changed from Positions ago to Fills ago (0 Positions ago should now be 1 Fill ago).
-
Value when Exit Activated:
-
Parameter has changed from Positions ago to Activations ago (0 Positions ago should now be 1 Activation ago).
-
Values now reflect activations that may not have been filled (i.e., the limit price was never reached), as well as activations that were filled.
-
Value when Exit Filed:
-
Parameter has changed from Positions ago to Fills ago (0 Positions ago should now be 1 Fill ago).
TradeStation’ is a registered Trademark of TradeStation Technologies, Inc. Neither TradeStation Technologies nor any of its affiliates has reviewed, certified, endorsed, approved, disapproved or recommended, and neither does or will review, certify, endorse, approve, disapprove or recommend, any trading software tool that is designed to be compatible with TradeStation Open Platform.
