September 17, 2019
IN THIS ISSUE
Design Your Neural Net Trading Model for Future Success
Traders have discovered that neural networks are an essential tool for developing trading models. Neural nets can find patterns in multiple indicators or other instrument data in one pass. Nets are the tool to use when you don’t know which trading rules to use. NeuroShell Trader gives you the advantage of creating individual models for different securities in one pass through the wizard.
In our August 2019 newsletter, we listed some tips for building successful neural net models. In this newsletter, we’re going to examine further what makes those models continue to perform on future markets and when it’s time to either retrain an existing model or create an entirely new model.
Select the Right Neural Net
Success begins with choosing a neural net algorithm designed for trading. The TurboProp 2 neural net in NeuroShell trains quickly and generalizes well on data not included in the training set (future market data). TurboProp 2 does not require tweaking network parameters such as learning rate and momentum, which are inherent in the backpropagation networks that are used by other software. Using TurboProp 2 allows the trader to concentrate on finding the best indicators and other inputs for the model, which our experience has shown results in better models.
How to Prevent Overfitting
Preventing a model from “memorizing” training data is called overfitting. If a model can’t generalize well, it will not continue to be successful in the future as markets change.
The biggest mistake is trying to build a prediction with too many inputs. We suggest about 5 inputs and no more than 10. If you want to start with more inputs, test them in groups of 5 and remove the ones with weak contribution factors.
Set smart ranges for your inputs on the inputs screen in the prediction wizard. The Trader takes an educated guess about the range for input parameters. However, this guess does not factor in knowledge of a specific indicator. For example, a default value of 0.5 might show a range from -1 to 1, even though that parameter can only range from 0 to 1. Check the indicator help file to learn the appropriate settings.
Link Parameters
While you are still on the input screen, you can link “like” parameters such as the number of periods that appear in different indicators. This limits the “degrees of freedom” in the model which results in a more robust model. Click here to learn how to link parameters.
Limit Number of Hidden Neurons
The program defaults to 10. We set the number at 4 hidden neurons when we want a model to generalize on new data. This setting appears under Advanced Training Parameters on the Training tab.
Stop Optimization
Did you that that stopping optimization for predictions and trading strategies may result in a better model in terms of future performance? You can stop optimization early and look at results. But if you do it too much your out-of-sample data is no longer truly out of sample. You’ll have to wait until more data is added to the chart to fairly judge performance.
Include a Comprehensive Set of Training Data
Last month we said to pick volatile issues so the neural net can find patterns. Taking that advice a step further, the training data should include up, down, and sideways markets to insure that the model knows what to do in future markets. While some of your favorite securities may only be trending upwards, look around and you’ll find others that cover the different market conditions.
Judge Performance on the Trading Period
Many trading platforms build and backtest models on all of the data in a chart. NeuroShell Trader has a feature that lets you specify an early segment of the data in the chart for creating and backtesting the model. You have the option to isolate a segment of the newest data to examine how to the model performs on data that was not included in the training set. This newest data is called the “trading” period.

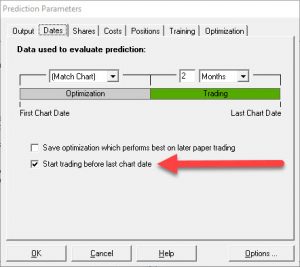
The dates tab lets you set how much trading data to hold out to evaluate your prediction model.
Both the Trader prediction and trading strategy wizards include a “Dates” tab where you can select how much data to include in the trading or “out-of-sample” period.
The amount of data to include in the trading period depends on the bar size and other factors. If you include too much data in the trading period, your model may not train on enough of the most recent data to keep up with current market conditions. On the other hand, you need a trading period with enough trades to examine if the trading signals are appropriate to up, down, and sideways markets. Don’t judge the model as successful based on one or two lucky trades.
To learn more, visit our tech support site: Select in-sample, paper, and out-of-sample periods – Commentary by Steve Ward.

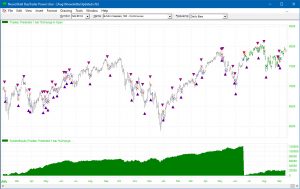
This prediction displays a number of correct signals in the out-of-sample period, highlighted by the green price bars on the right.
Market conditions change. If a model works for 6 months, you are lucky. Neural nets need to be retrained or you need to use an net from one of the Trader Add-ons that you can set to retrain as often as every bar.
One suggestion is to copy your model and reoptimize the copy with the more recent data that has been added to the chart. Watch both models for a few days to see which one is producing more accurate trading signals.
Another suggestion is to use Trader add-ons that automatically update predictions or are designed to generalize on new data. These add-ons include:
Adaptive TurboProp 2 – like the neural nets in the Prediction Wizard, but they operate like an indicator and automatically retrain themselves. You can optimize training set size, walkforward interval, number of hidden neurons, and even the lookahead period.
Adaptive Net Indicators – neural nets especially adapted to pattern recognition, some of which automatically include lags of inputs. The net retrains with each new bar. Useful for building your own adaptive moving averages.
Neural Indicators – These nets generalize very well, meaning they do not have a strong tendency to “overfit” or “curvefit”. These nets give you the probability that the current situation is a buy or sell opportunity. Some of them are “recurrent nets” that automatically look back in time.
Select an add-on, scroll to the bottom of the pop-up and press on the “more details” link to read the full manual for each add-on.
