
November 16, 2017
IN THIS ISSUE
WE NEED YOUR VOTE
INDICATOR TRICKS YOU NEED TO KNOW
The polls are now open for the Technical Analysis of STOCKS & COMMODITIES (TASC) magazine’s Readers’ Choice Awards for 2018. The TASC readers are very conscious of the award winners and your vote helps fund technical support. This helps you develop successful trading systems so it’s a win/win arrangement for everyone.
INDICATOR TRICKS YOU NEED TO KNOW
Reset Calculations for an Indicator Every Day
The DayTrader versions of NeuroShell Trader include an indicator category called Intraday Basic with indicators such as Day High, Open, Low, Close and Range. Our example chart shows the high value in the second subgraph changing with every bar. However, if you use the DayHigh indicator instead, it only changes when a new high value is reached and it resets every day.
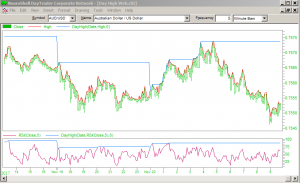
The DayHigh version of the data stream resets every day. You can choose either price or indicators for the data stream.
These indicators are not confined to only working with price data. You can make them work for your indicators as well. In our example chart, we substituted the RSI indicator for the high value in the DayHigh indicator. Unlike the RSI indicator itself which changes with every bar, the DayHigh version only changes when a new high value is reached AND is reset every day.
Click here to download the chart.