
March 5, 2019
IN THIS ISSUE
NEUROSHELL TRADER WINS 2019 TASC READERS’ CHOICE AWARD
USE ON-BALANCE VOLUME TO CONFIRM TREND
DOES YOUR PANEL OF EXPERTS INCLUDE CHAOSHUNTER MODELS?
_____________________________________________________________________
 NeuroShell Trader is the
#1 AI Trading Software
17 Years in a Row
as voted by the readers of
TECHNICAL ANALYSIS of
Stocks and Commodities Magazine
The staff at Ward Systems Group wants to express our gratitude to the readers who took the time to vote for NeuroShell Trader. Your support is appreciated and we look forward to working with you in the future. our thanks would not be complete if we didn’t include the wonderful staff at Technical Analysis of STOCKS & COMMODITIES magazine for producing an industry leading publication each month.
~~~~~~~~~~~~~~~~~~~~~~~~~~~~~~
USE ON-BALANCE VOLUME TO CONFIRM TREND
~~~~~~~~~~~~~~~~~~~~~~~~~~~~~~
Based on the article “All About OBV” by John Devcic
from the March 2019 issue of Technical Analysis of STOCKS & COMMODITIES
The On-Balance Volume (OBV) indicator measures market trend by creating a running
total of volume based on changes in price. For example, if the daily close is greater
than the previous day’s close, the daily volume is added to the running total volume.
If the daily close is less than the previous day’s close, the daily volume is subtracted
from the running total volume. The On-Balance Volume indicator is included in the
Volume category in NeuroShell Trader.
The article attributes the OBV calculations to a book by Joseph Granville called
“Granville’s New Key To Stock Market Profits,” published in 1963. Granville’s
book says that prices are expected to rise if OBV is rising and the current price
is either flat or falling slightly. Prices are expected to fall if OBV is falling
and current prices are either flat or rising slightly.
The Devic article says the key to using the OBV in a trading system is to look for
divergences between price and the OBV indicator. He describes a “bearish” divergence
as a period when price is advancing while the OBV line is declining, while a “bullish”
divergence occurs when price is declining but the OBV is advancing.
The difficulty in crafting rules for an OBV trading system is knowing how many periods
should be included in the advancing and declining calculations. That’s where the
genetic algorithm optimizer in NeuroShell Trader can be the best tool to customize
the number of periods for the different securities you want to trade.
We created a Long Entry rule using the Boolean AND indicator to combine both the
price and OBV rules. The rules compare the current value of the close and OBV
to lagged versions of those values. The optimizer determines how many periods to
lag the values.

In order to generate a trade when both the price and OBV conditions occurred on
the same bar, we linked the periods condition in both the Long and Short entry conditions.
Linking the number of periods insures that the same lagged value is used for both
price and OBV calculations in the Long and Short Entry rules.
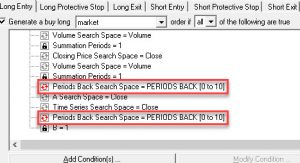 The sections of the entry rule outlined in red are linked together to optimize to the same value.
To link indicator parameters, click on the “+” sign in front of the trading rule
you want to modify and then select the parameters you want to link.
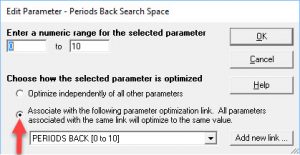 Click on the button to modify condition and then choose the button to “Associate
with the following parameter optimization link”. You can either use the default
name for the link or give it a custom name. Set an appropriate range for the number
of lag periods. If you want to add more than one link, click on the Add New Link
button.
The OBV Trading Strategy is displayed in the top subgraph in the chart below.
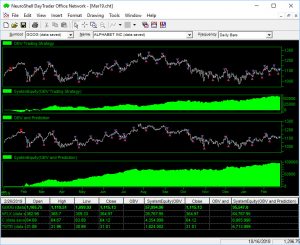
This chart features both the OBV Trading Strategy and a combination system with
a neural net prediction.
Devic’s article recommends confirming the trading signals from the OBV system with
other trading signals. Devic used a moving average crossover as an example. In
our example, we combined a prediction with the OBV Trading Strategy and the results
are shown in the bottom half of the above chart.
Click here to download a copy of the example chart, which you should customize for changes
in market conditions or different securities.
~~~~~~~~~~~~~~~~~~~~~~~~~~~~~~
DOES YOUR PANEL OF EXPERTS INCLUDE CHAOSHUNTER MODELS?
~~~~~~~~~~~~~~~~~~~~~~~~~~~~~~
We have previously published proof that ensemble trading systems that combine models
have a higher probability of generating a correct trading signal. Visit our tech
support site at Ensemble Estimators for details.
In addition to combining traditional trading rules and predictions as we did in
the On Balance Volume chart above, we turned to another technique that generates
readable equations that model data by using genetic algorithm optimization.
We exported the price data as well as the On Balance Volume data stream from our
NeuroShell Trader chart for use in ChaosHunter.
In ChaosHunter we selected the price data and the On Balance Volume indicator along
with Arithmetic, algebra functions and the technical indicators momentum, rate of
change %, Spread %, slope and lag.
ChaosHunter developed the formula below:
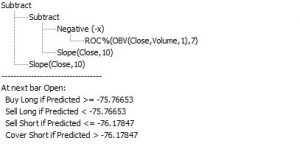
We called the formula using the ChaosHunter signal indicator that is included in
NeuroShell Trader. The signal lets you know whether you should enter or exit a
long or short position
as follows using the A = B relational indicator.
Long Entry: ChaosHunter signal = 1
Long Exit: ChaosHunter signal = 0
Short Entry: ChaosHunter signal = -1
Short Exit: ChaosHunter signal = 0
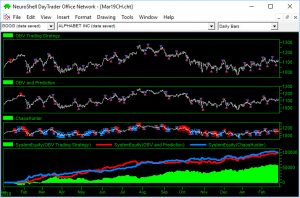
This chart adds the trading system based on the ChaosHunter formula to the bottom
of our previous chart.
In the chart above, the blue line represents the equity curve for the ChaosHunter
trading strategy. You could easily combine all three trading systems into an ensemble
system that says to enter a trade if two out of three conditions are true. We only
require one condition to be true to exit a trade.
Click here to download the chart that includes the ChaosHunter model.