
June 25, 2019
IN THIS ISSUE
BOLLINGER BAND PREDICTIONS ADAPT TO VOLATILE MARKETS
DISCUSSION FORUM: DYNAMICALLY SWAP CHART SYMBOLS
_________________________________________________________________________________
BOLLINGER BAND PREDICTIONS ADAPT TO VOLATILE MARKETS
By Marge Sherald, President
Bollinger Bands are well known for aiding trading decisions based on market volatility. We’ve recently received some queries from NeuroShell Trader users on how to incorporate Bollinger Bands in their trading systems.
The Trader comes with an example Trading Strategy template that enters a long position when the price breaks out below its Bollinger Band Low Channel and exits the trade with a trailing stop when the close either meets or crosses below the lowest market price reached over the last number of periods that you specify. You can add similar conditions to the short side and let the optimizer determine the number of periods and standard deviation settings that can maximize profit.
Another approach is to use the Bollinger Band: %B indicator which provides a measure of the price relative to the Bollinger high and low bands.
- Values above 100 indicate a price that is above the high band which may be interpreted as a short signal
- Values below 0 indicate a price that is below the low band which can serve as a long entry signal
- Values between 0 and 100 indicate a price that is between the high and low bands so no trading signals are generated
By using separate copies of the Bollinger Band %B indicator for the Long and Short entry rules in NeuroShell Trader, the genetic algorithm can determine the optimal values for the number of periods and standard deviation settings for each side of the trade. My testing has shown that they are often different.
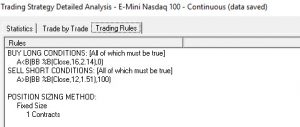
The optimizer chose different period and standard deviation parameters for the BB %B indicators in the long and short entry conditions.
John Bollinger advises that the Bollinger Bands should be combined with other indicators for a trade confirmation. The question then becomes which indicators should be used. I tried several but wasn’t entirely satisfied with the results. Rather than trying to run a series of tests with individual rules, I decided to let a neural net do the work.
The inputs to my test neural net were the Bollinger Band High and Low, %B, and OnBalance Volume indicators as well as the Volatility Index (VIX). The inputs selected by the net are listed below.
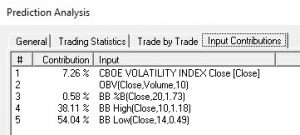 This list displays the contribution factor for each net input.
The chart displays the trading system based on the BB %B indicator as well as the neural network prediction. The %B rule based system generated a net profit of $107,710 while the neural network prediction produced a profit of $135,855.
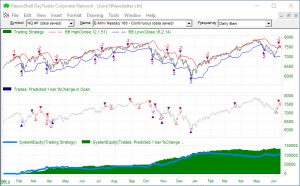
The %B trading rule system appears at the top of the chart with the neural net prediction displayed below.
You can retrain the net on a regular basis to adjust the model to match current market conditions. If you want to automate market updates, substitute a net in the Adaptive TurboProp 2 add-on for the prediction wizard. (You can read the AT2 manual at the end of the description.) By using AT2, the model could retrain as often as every bar.
Click here to download the example chart.
_________________________________________________________________________________________________
DISCUSSION FORUM: DYNAMICALLY SWAP CHART SYMBOLS
_________________________________________________________________________________________________
If you haven’t visited the discussion forum on Nstsupport.wardsystemsgroup.com, you’re missing out on some great tips.
Two users recently shared advice on how to dynamically update their charts with the symbols they are currently following. They’ve figured out how to substitute the symbols in existing charts using a batch processing method.
Another user is looking to share a list for popular screening tools.
In addition to the forum, the tech support site includes example NeuroShell Trader charts that you can download from our monthly newsletters and the traders’ tips section of TECHNICAL ANALYSIS OF Stocks and Commodities magazine.