
June 13, 2018
IN THIS ISSUE
CAN YOUR MODELS EVOLVE WITH CHANGING MARKETS?
As market volatility continues, your trading rules that include moving averages can adapt by linking the average periods to a time series rather than a fixed period.
Adaptive Moving Average Indicator Chart
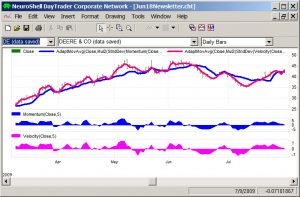
The chart below shows two different versions of the Adaptive Moving Average indicator.
Blue Line: Adaptive Mov Avg periods = Momentum * Stnd Dev Multiplier
Pink Line: Adaptive Mov Avg periods = Velocity * Stnd Dev Multiplier
Notice how the pink Velocity indicator is slightly ahead of the corresponding Momentum indicator in identifying peaks and valleys. Such an indicator would be beneficial for creating profitable trading rules.
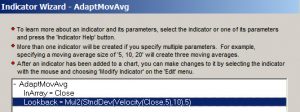
Below are the indicator parameters for the Adaptive Moving Average using the Velocity indicator that we programmed as a Dynamic Link Library (DLL) in Power Basic. The lookback or average period is computed by multiplying the Velocity indicator by a Standard Deviation value. The indicator parameters may be optimized.
You can download our example chart and the Dynamic Link Library (DLL) we created by clicking here.
Note that you don’t have to program anything to use this indicator.
Simply move the AdaptiveAverage.DLL to your c:\NeuroShell Trader Template directory and then copy the chart to the c:\NeuroShell Trader charts directory. Once you’ve opened the chart, the indicator will be saved in the Custom category for use in other charts.
To examine the Power Basic source code for this indicator, click here.