
July 23, 2019
IN THIS ISSUE
BUILD MODELS THAT EVOLVE AS MARKETS CHANGE
By Marge Sherald, President
The Neural Indicators add-on for NeuroShell Trader takes an entirely different approach
to generating trading signals. The network architectures look like variations of backpropagation
networks, but you don’t tell it what to predict. It can produce trading signals simply based on
patterns in a group of indicators.
Why take the time to learn about these strange creatures?
1. These networks evolve as markets change – no retraining necessary
2. These networks don’t overfit training data so they are able to handle whatever
the market throws at you. They do this by limiting the number of inputs and hidden
neurons.
3. Neural Indicators provide probabilities of the signals they produce. For example,
a sell closer to 1 means the stronger the probability of sell. The closer to -1,
the stronger the probability of “don’t’ sell”.
4. You can use these networks to confirm a trading signal from the Prediction Wizard
or other models, including another Neural Indicator model.
How do they work?
Neural Indicators “learn” how to give their signals based upon evolutionary pressure.
The genetic algorithm (GA) in the Trader “evolves” Neural Indicators that give better
and better signals. Survival of the fittest controls the evolutionary process as
usual, where fitness is determined by how much money the Neural Indicators make
or how they meet a different objective that you set in the Trader.
The Neural Indicators add-on comes with several different network architectures.
While the net architectures might look complicated, you do not have to understand
how these architectures work in order to build profitable trading systems. You can
insert Neural Indicators into your trading systems and let the optimizer find the
appropriate settings.
Ward Nets as an example
This architecture has two different “activation functions” in the hidden neurons.
(Activation functions tell a network whether to fire a trading signal.) If your
model includes two different activation functions and they agree to produce a signal,
it is similar to asking two different experts whether to put on a trade.
We called them “Ward Nets” since Ward Systems Group invented them many years ago
(they first appeared in our classic product NeuroShell 2). The genetic algorithm
will find out how to pick the activation functions for you. Ward Nets include Ward2,
Ward3, Ward4, Ward5, and Ward6, depending upon the number of inputs. These are the
indicators that give the probability of a correct signal. You enter them as a trading
rule such as “Ward 3 > 0”.
The “C” conditional versions of the indicators may be used as complete trading rules.
Use one for a Long Entry and another for a Short Entry and they evolve the correct
indicator parameters for each side. You don’t have to use the “Ward 3 > 0” format.
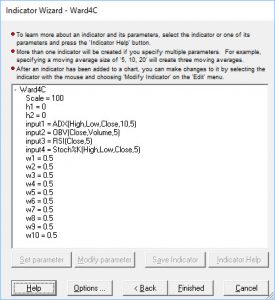
This is a list of indicator parameters for a Ward Net with 4 inputs.
SCALING
The scale parameter is your specification of how far back you want the NI to look
to compute the input scaling. All inputs are scaled (or normalized) into the same
small range so that those with larger values (e.g., volume) do not exert more influence
on the network than those whose values are smaller (e.g., percent change in close).
Weights will scale themselves somewhat (adjust to smaller values) to compensate
for smaller magnitude differences. However, large differences in magnitude have
to be handled by scaling.
The scale parameter, by virtue of the fact that it is a moving window, also normalizes
over time in each input as well as normalizing over all inputs at a fixed point
in time. As an input such as price rises, the scaling window moves with it. This
means that, unlike most neural networks, including the neural network in the Prediction
Wizard, the same input values can give different outputs later in time when the markets are different, as you would want them to do. Larger values of scale decrease this normalization, while smaller values increase it. Let the optimizer decide!
h1 and h2
h1 refers to a Gaussian activation function while h2 refers to hyperbolic tangent.
Using two different activation functions give you two different views of the same
data.
w parameters
w parameters refer to the weighting factors for each of the inputs. The smart thing
to do is let the Trader’s optimizer set the values.
This chart shows the results of a neural indicator model applied to the S&P 500
E-Mini.

The Ward Net model is profitable for both E-minis in the out-of-sample period.
Click here to download the example chart. You must own the Neural
Indicators add-on to examine this chart.