
July 20, 2017
IN THIS ISSUE
CONDITIONAL SWITCH TRADING
Not Exactly Pair Trading
Traditional pair trading stipulates that you be market neutral by going long one security and short the other usually based on the crossover of one price over another. The trading signals appear on exactly the same bar. In NeuroShell Trader the easiest way to create this type of trading system is to use either of the Pair indicators from Advanced Indicator Set 3.
A variation on this type of system would be to buy Stock 1 or Stock 2 based on an indicator calculated on Stock 1. For example, you may have noticed a pair of securities that have a cause and effect relationship. One security might lead another, but there are times when it is better to own the non-leading stock.
Note: We’re going to show you a technique that allows you to create such a system in NeuroShell Trader in a single chart. However, you could also build the same system in two separate charts using the Trader’s ability to work with other instrument data in a model.
Our system buys Stock 1 when a condition based on Stock 1 is true and buys Stock 2 when the opposite condition in Stock 1 is true. You only own one stock at a time.
The trick is to switch between the two stocks in the same chart even though the NeuroShell Trader usually applies the same rules in the same direction to both chart pages.
The buy/sell rules for both stocks are based on the relationship between the close of home Depot compared to a 5 period moving average of Home Depot.
Building the Model
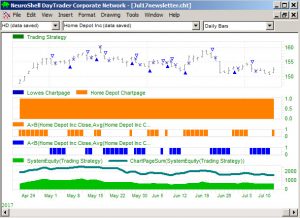
- Start with a daily chart with the two stocks of interest: Home Depot (HD) and Lowes (LOW).
- Insert Other Instrument Data versions of HD and LOW on the chart.
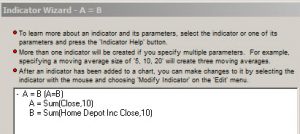
This allows us to create custom indicators that tell Trader which chart page is generating the trading signal. On the chart these indicators appear as Home Depot Chartpage and Lowes Chartpage.
The indicators work by comparing a 10 period sum of the close of the current chart page to a 10 period sum of the other instrument version of the close for each stock. The idea is that the sums would only match exactly on the correct chart page, producing a value of 1 (true) that can be used in a trading system. A non-match produces an output of 0 (false). These true/false conditions produce opposite results on the different chart pages. (You can check this out by switching chart pages on the example chart that you can download below.) When the indicator below appears on the Home Depot chart, the result is true for Home Depot and false for Lowes.
- Next decide on the trading rules you want to use.
In this example, the trading decision is based on Home Depot.
Buy HD when the HD close > the 5 period AVG of HD
Buy LOW when HD close < the 5 period AVG of HD
We buy equal dollar amounts of each stock.
- Combine the custom Chartpage indicators with the trading rules as follows:

These rules combine the chart page indicators and the HD buy/sell conditions.
Long Entry
The top rule says to buy if this is the Home Depot page and the close > MVA(5) of HD close.
The bottom rule buys if the page is Lowes and the close < MVA(5) of HD close.
Short Entry
The Short Entry rules check for which chart page is displayed and exits the trade based on a reversal of the entry conditions.
Of course, other rules may be substituted for the moving average conditions in the example.
Click here to download a zip file which contains the chart referenced above.