The following are the primary new features in the 1.4 release of the Trader:
- New chart formatting features have been added. Now you can turn off our automatic Y-Axis (price) scaling, and set your own fixed scale, if you prefer that. You can also make your own custom foreground and background color scheme. To access these new features, go to the Edit menu, then select Format Chart. You can also right-click, then choose Format Chart.
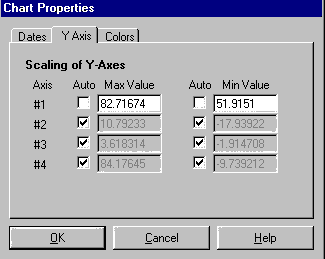
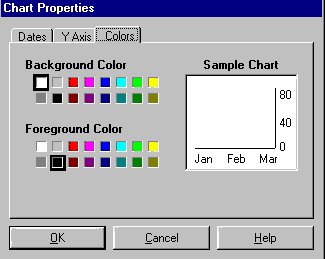
- Dialog box sizes are now remembered. Once you open one of our dialog boxes to a larger size on your screen, it will stay that size until you change it again. This eliminates the constant resizing of some of these dialog boxes.
- A new out of sample net or “data stream” has been added when you train a network with walk-forward tests. This is a very powerful and useful feature. The out of sample data stream, which appears in green, essentially “glues together” all of the evaluation periods for all of the walk-forward tests. This means you can see, in one continuous prediction line, how the whole period would be predicted by always using the latest net that did not include the data in the training set. Furthermore, when going forward in time past the current net’s training period, this net’s prediction uses the current net. This unique net can be used in trading strategies, or in indicators just like either the current net or a walk-forward net. In fact, this is the recommendation so that you will always be seeing out of sample results. In the past, it uses the walk-forward nets, and in the future it uses the current net. In both cases, it is always showing out of sample results.
Since this is so important, we’ll try to explain it a different way. Think of this “out of sample net” as a combo net that looks at the date of the inputs. It then uses an appropriate net to make the prediction. The appropriate net is not a net that was trained on this date, because that net has “seen” the answers. The appropriate net is the most recent walk-forward net trained prior to the date of the inputs. For all bars in the future, the current net is the appropriate net. The picture below may help illustrate this.
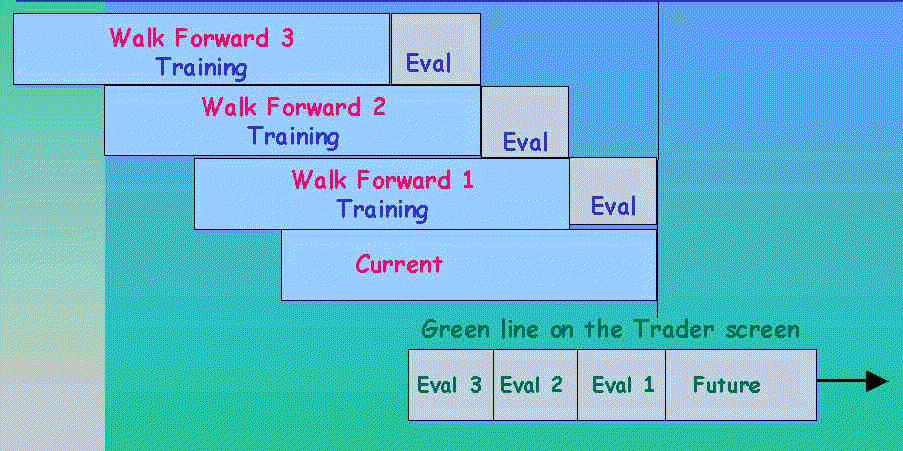
The green out of sample net will automatically show up on the chart if you train a completely new net. It is available on old nets you made with release 1.3, but you will have to insert it on the chart yourself (Insert existing data/calculations).
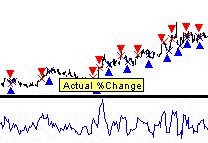
- We have added pop-up labels to give the full name of a line on the chart. All you have to do is put the mouse over the chart line or the legend label and the pop-up window will appear to make the title clear and readable in case the legend is too small.
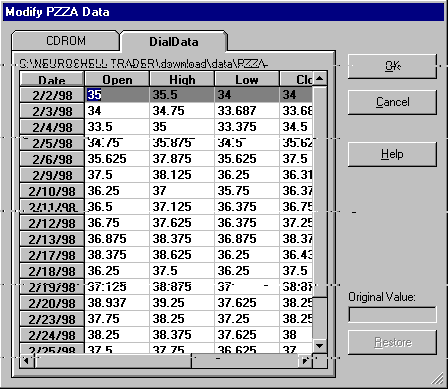
- It is now possible to edit data files. To do this, you simply modify a raw data stream (like the close) with the right mouse button, just like you would modify an indicator, prediction, or trading strategy. (You can also left click and use the edit menu.) A spreadsheet window allows you to make changes to the data. These changes can later be unmodified even, because the changes are stored internally in an override file.
- In the Data Window Mode, the vertical line now has an added horizontal line to make a cross hair. In this mode, you can now do many menu functions that were not possible in this mode.
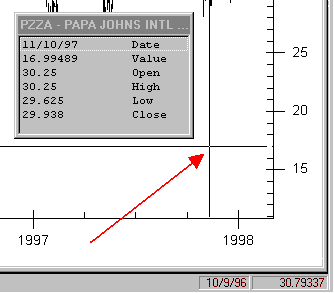
- On all charts, the current mouse chart coordinates are now displayed on the lower right side of the screen. You can point to any point on the chart and see the date and price level where the mouse is positioned. Refer to the lower right hand corner of the chart above.
- Almost a hundred new indicators have been added in these categories:
Basic – (4) – Sum, Multiply, Cumulative Sum, Cumulative Multiply
Statistics – (1) – Standard Normal: Data Point
Arithmetic – (3) – Average2, Average3, Average4
Trading Strategy: Position Information – (13)
Trading Strategy: System Information – (66)
Selective Calculation – (9)
- We have shortened the nomenclature used for naming predictions. For example, instead of “5 day percent change in close as predicted 5 days ago” we will now simply use “% change as predicted 5 days ago.”
- The Trader now detects that predictions need retraining or trading strategies need recalculating and so informs the user. The user is told the reason (e.g., the training data has changed) and allows the user the opportunity to do so or ignore the warning. This is done on a page by page basis when a chart page is loaded.
- There is new sort functionality so that you can sort dialog box column entries just by clicking the column name. This is in the Prediction Wizard, Trading Strategy Wizard (Trade by Trade Analysis and Results screens), and Data Sources Dialog.
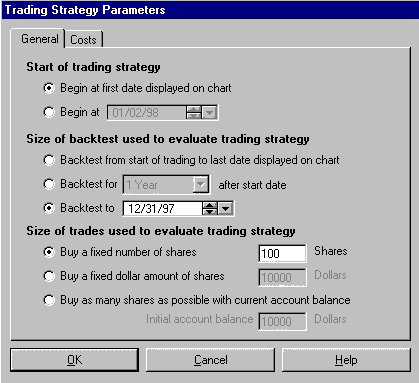
- In the Trading Strategy Wizard, you can now set up to backtest through a certain date instead of selecting a period of time.
- The NeuroShell Trader now reads CSI data files (downloaded from Commodity Systems, Inc.)
- The new selective calculation indicator category contains powerful indicators that allow you to include data values in a calculation only if certain conditions are met. For example, suppose you want a moving average, but you only want to include Mondays in the moving average. You would choose the selective moving average and give it as a condition the Monday flag. Or suppose you want to take the minimum low only on up days (when the close is higher than the last day’s close). You would choose the selective minimum value of the low, and give it the condition that the close is > the one day lag of the close.
- On weekly and monthly charts created from daily data, there is now an average volume data series in addition to a volume data series. This is because the volume data series will look much smaller in weeks that have less than 5 days. The average volume may be a better normalized input for a neural net.
- On weekly and monthly charts created from daily data, the open interest has been changed so that it now only returns the last open interest value instead of the sum of the open interest across the whole bar. We believe this is a more proper way to calculate open interest on weekly and monthly charts.
- You can now buy and sell on market close. If you choose market close instead of market, the fill price will be the close of the next day instead of the open for the next day. This is useful for certain types of mutual funds that fill at the next day’s close. It also means that it is now possible to buy on market, sell on market close, and have both transactions take place the same day, assuming the buy/sell conditions were met on the same day.
- With limit, stop, and stop limit orders the price levels are now good for a day. Each day that the entry/exit conditions are met, the limit, stop, or stop limit order is good again for a day. In previous releases, they were essentially good until canceled with no way to cancel them.
- The Trader now allows a short entry to occur on the same bar as a long exit market order. If the condition for a short entry is true on the same bar that the condition for the long exit market order is true, then the trader will both exit the long position and enter the short position in the next bar. On the graph, the long entry exit triangle (empty downward blue triangle) will not be shown. Only the short entry signal (solid downward red triangle) will be shown for the bar on which the long exit and short entry condition is true.
- There is now a “Rebacktest” button at the end of the Trading Strategy Wizard. This button now makes modification of a trading strategy work the same way modification of a prediction works. You need to use this button to backtest again if you have made no changes to the trading strategy. (Before you had to modify the strategy, go backwards in the wizard, then go forward again.) If you do make changes, the backtest will run again automatically when you go forward without using the button.
- The examples have been changed. Examples 1, 2, and 3 are now much more tutorial in nature. Most of the examples on our www.neuroshell.com/ web page have been updated and added as examples 4 through 9 in release 1.4.1.
- The buy/sell triangles will now be shown on the trading strategy chart in the space between the day of the signal and the next day (the day the order is filled). Previously they were on top of the day of the signal.
- We have slightly modified some indicators to increase the precision of the calculations internally. The values produced will be slightly different, usually in the 3rd or 4th significant digit, but more accurate. If you retrain any nets using any of these indicators as inputs, there will be slight differences in the results.
In a trading strategy, there is a possibility that small differences in a network’s output can make larger differences in profit if those small differences cause a trade to be missed, for example. It is very likely that any charts containing nets using these indicators may now give different results, especially if you retrain the nets..
Below is a list of indicators affected.
SIMPLE MOVING AVERAGE CATEGORY
(All Indicators)
EXPONENTIAL MOVING AVERAGE CATEGORY
(All Indicators)
LINERALY WEIGHTED MOVING AVERAGE CATEGORY
(All Indicators)
VOLUME WEIGHTED MOVING AVERAGE CATEGORY
(All Indicators)
CHANGE CATEGORY
Average Negative Momentum
Average Positive Momentum
Minimum Momentum
Maximum Momentum
Cumulative Negative Momentum
Cumulative Positive Momentum
Cumulative Absolute Momentum
TIME SERIES CATEGORY
Bollinger Band: Low
Bollinger Band: High
Bollinger Band: %B
Bollinger Band: Band Width Percent
PRICE MOMENTUM & PRICE MOMENTUM SMOOTHED CATEGORIES
Commodity Channel Index
Accumulation/Distribution
VOLUME & VOLUME SMOOTHED CATEGORIES
Arms Ease of Movement
Negative Volume Index
On Balance Volume
Positive Volume Index
Volume Accumulation #1
Volume Accumulation #2
Volume Accumulation #3
Volume Life Force
Volume Price Trend
