
August 22, 2017
IN THIS ISSUE
LEADING INDICATORS
Graph Indicators to Find Market Leaders
Some of the articles about building predictions that appear on our new tech support website, www.nstsupport.wardsystemsgroup.com say to use leading indicators as an input to the prediction. But what is a leading indicator and how can you identify one?
Leading indicators show an upward (or downward) movement before the price moves. The indicators vary by market and/or instrument.
The chart below displays two leading indicators for SPY, the S&P 500 ETF.
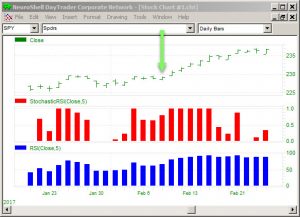
Price was going sideways and even had a slight down movement, yet the Stochastic RSI and RSI indicators display upward movement ahead of an uptrend in price.
The green arrow on the chart above marks a time period when the RSI indicator from the Price Momentum category and Stochastic RSI from Advanced Indicator Set 2 show an upturn while the price is still flat. The price turns upward in the next bar or so. These indicators would be ideal candidates as potential inputs to a neural network prediction for SPY.
If an indicator graph shows that it is simply following price, you may want to consider using another indicator.
Graphing Identifies Indicator Diversity
Another reason to graph indicators is to eliminate indicators that calculate peaks and valleys at the same point. If an indicator graphs a unique pattern, it is more likely to feed distinct information into your model.
Click here to download the example chart. You must own Advanced Indicator Set 2 to view the Stochastic Indicator on the chart.